




Good six-month retention for a consumer social product sits near 25 percent. For enterprise SaaS, good is 75 percent. Same metric, triple the number, same verdict. Those benchmarks come from Lenny Rachitsky's surveys of more than 500 products, and they expose what dashboards hide: a number means nothing until you know what counts as good for your product, at your stage, right now.
That judgment is the core of data analytics for product managers. Not SQL. Not chart-building. Choosing the question, finding the number that answers it, and committing to a threshold before the data arrives.
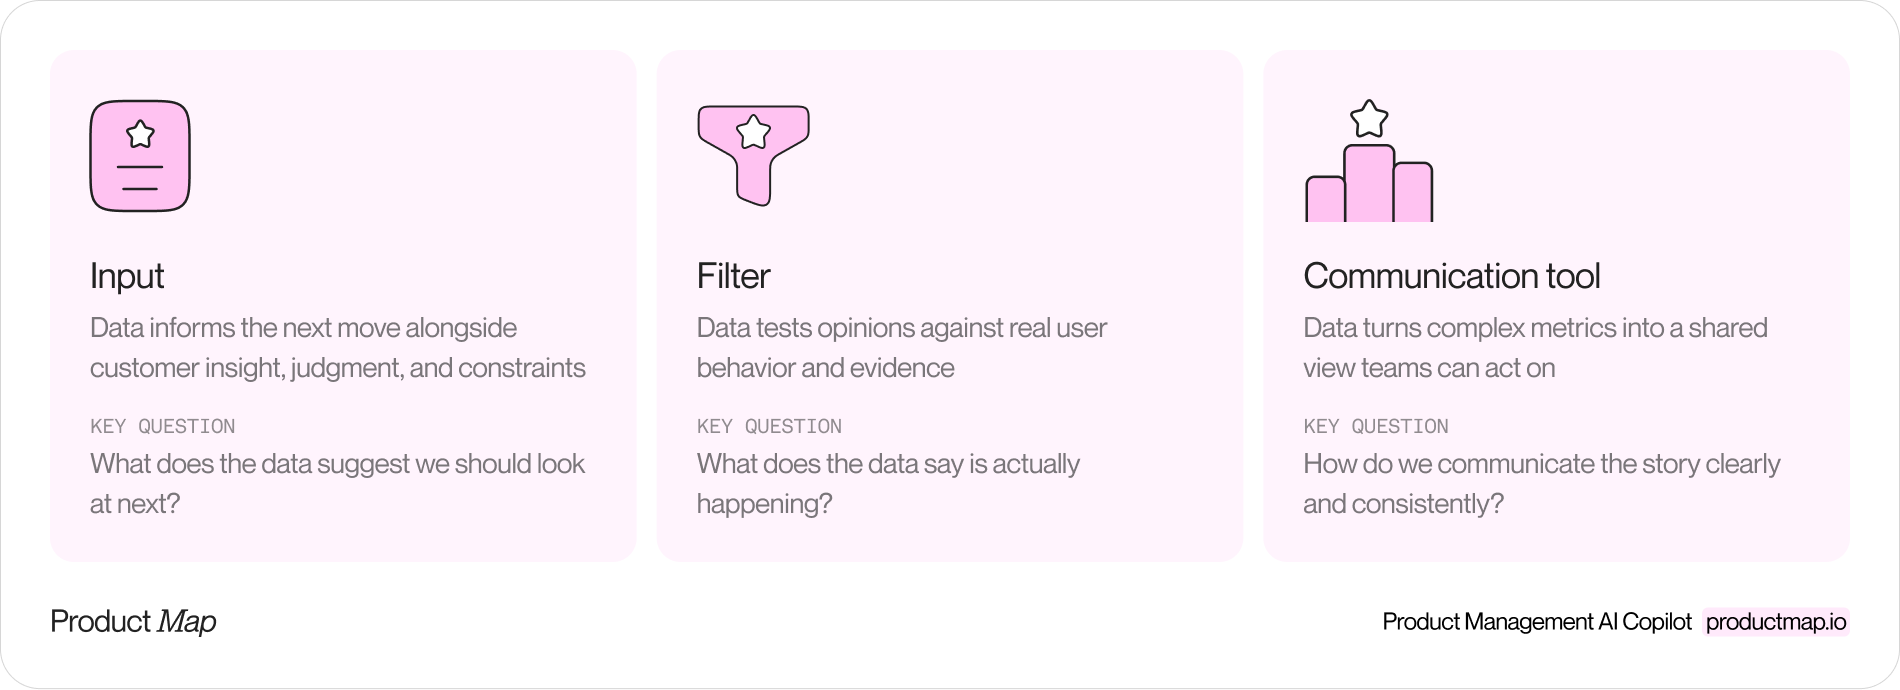
Data is an input, a filter, and a communication tool
Data-driven product management gets caricatured as "the numbers decide." In practice, data serves three distinct purposes, and mixing them up produces bad decisions and worse meetings.
- Input: data informs the next move, but it competes with customer interviews, strategic judgment, and technical constraints. Teams relying on quantitative data alone tend to optimize for small increments instead of meaningful change.
- Filter: when the loudest opinion in the room conflicts with the behavior of ten thousand users, data gives the team something to reason from other than seniority.
- Communication tool: a well-built metric view of the business creates shared understanding without every stakeholder digging through raw numbers.
Quantitative data tells you what is happening and at what scale. Qualitative data (interviews, session recordings, support tickets) tells you why. A funnel shows the step where users quit. Five interviews show the confusion causing it. You need both, in that order: quantitative to locate the problem, qualitative to explain it.
Five data types every product manager should track
Product management analytics covers more ground than event tracking. Five data types, each answering a different question:
- User and behavioral data: who your users are and what they do inside the product. Session paths, feature interactions, drop-off points.
- Product usage data: frequency, depth, and duration of use. Activation rates, retention curves, and the actions separating retained users from churned ones.
- Business and revenue data: conversion to paid, expansion, churn, and payback. This is where product behavior connects to money.
- Market and competitive data: category growth, win-loss reasons, competitor releases, pricing moves.
- Technical data: load times, error rates, uptime. A checkout converting poorly might be slow, not confusing.
Start with usage and business data. They sit closest to the decisions you control.
Start with your product's stage, not the dashboard
The strongest operating model for product analytics comes from Lean Analytics by Alistair Croll and Benjamin Yoskovitz. Start with the stage your product is in. Name the biggest risk at that stage. Pick the One Metric That Matters for that risk, and ignore the rest until it moves.
The stages run from empathy through stickiness, virality, revenue, and scale. At empathy, repeated evidence of the problem beats any volume metric. At stickiness, retention and time-to-value beat signups. At revenue, trial-to-paid conversion and payback take over. Each stage swaps the question, so it swaps the metric.
A good metric is understandable, comparative, and behavior-changing. Express it as a ratio or a rate, not a raw total.
Raw counts hide reality. More signups can mask worse activation. More active users can hide weaker retention. Then commit to a line in the sand: a success threshold, set publicly, before the experiment starts. The median activation rate across SaaS products is 25 percent, and B2B enterprise products average around 45. Take a credible benchmark, adjust it for your segment and business model, and hold yourself to it. Without the commitment, teams celebrate activity without knowing whether it was enough.
The Product Analytics guide on Product Map works through this full system: Lean Analytics stages, funnel analysis for locating friction, cohort analysis for testing whether value lasts, and KPI trees for connecting outcomes to drivers, with setup steps for each.
.png)
A six-step analytics workflow
Analytics work goes wrong at the start far more often than at the math. A repeatable sequence protects you:
- Define the question. "Why did week-two retention drop for March signups?" beats "look into retention." A hypothesis makes step four falsifiable.
- Locate the data. Name the events and systems involved, and check whether tracking exists before promising an answer.
- Clean and segment. Split by channel, persona, and engagement level. A blended conversion rate hides the segment where the problem lives.
- Analyze with the right lens. Funnels locate where a sequence breaks. Cohorts show whether value lasts over time. Time-between-steps catches hesitation a conversion rate misses.
- Act and prioritize. Rank fixes by the volume of users affected, whether the problem sits before the aha moment, and how strategic the segment is.
- Close the loop. Compare new cohorts against old ones after the fix ships. If the metric didn't move, the insight was wrong, and knowing so is progress.
Six steps. One decision at the end. If a piece of analysis can't name the decision it feeds, it belongs in the backlog, not on your screen.
.png)
Build the metric system first
A one-off analysis answers today's question. A metric system answers the team's questions all quarter. Three structures do most of the work:
- North star metric: the single measure of long-term value creation. It stays stable across quarters and keeps every team pointed at user value.
- One Metric That Matters: tactical and temporary. It reflects the current constraint and changes as the constraint changes. Teams confuse the two and end up chasing ten strategic numbers at once.
- KPI tree: built top-down from the business outcome, through product drivers, to user behaviors the team can influence. Branches shouldn't overlap, and together they should explain the parent metric in full. A tree failing this test produces diagnoses no one trusts.
Separate leading indicators from lagging ones. Revenue is lagging; the activation behaviors driving it are leading. Frameworks like HEART and AARRR help you pick the layer you're measuring instead of mixing lifecycle stages in one dashboard.
The Product Metrics guide on Product Map covers this layer in depth: north star definition, KPI tree construction, leading and lagging indicators, and the metric frameworks worth knowing.
.png)
Four pitfalls that flip a good analysis into fiction
- Correlation read as causation. Users of feature X retain better, so the team pushes feature X. But power users adopt every feature; the causality can run backward. Test with a cohort comparison before betting the roadmap on it.
- Vanity metrics. Page views, cumulative signups, and total downloads always go up. A metric with no bad outcome is decoration, not measurement.
- Calling experiments early. Peeking at an A/B test daily and stopping at the first significant result manufactures wins. Fix the sample size and the end date before launch.
- Skipping segmentation. An average across all users describes nobody. The same funnel can convert at 60 percent from one channel and 12 from another.
Each pitfall shares a root: the conclusion arrived before the discipline did.
Analytics as communication
Here's the part most analytics content skips, and senior operators learn the hard way: analysis creates zero value until someone acts on it, and people act on what they understand.
If a metric can't be explained in one sentence, it won't create alignment. Design the communication as deliberately as the metrics. A KPI tree on one page beats a 40-chart dashboard, because a stakeholder can trace revenue down to the behavior their team owns.
And keep paying off empathy debt. A team reading dashboards without talking to users accumulates it quietly, then pays it back in misread charts. The PM who watched five session recordings this week reads the funnel differently from the one who didn't.
Next planning cycle, run the sequence once: name your product's stage, pick the one metric reflecting its biggest risk, and set a line in the sand in front of the team. One metric, one threshold, one decision it feeds. That single habit does more for data-driven product management than any new dashboard will.