




Run the same twenty-item backlog through RICE, MoSCoW, and a value-effort matrix, and you'll get three different top priorities. Same items, same team, three answers. This isn't a flaw in the frameworks. Each one measures a different definition of "important," and picking the framework is itself the first prioritization decision you make.
The stakes are higher than most teams admit. Pendo's feature adoption research found around 80 percent of features in the average software product are rarely or never used. Every one of those features won a prioritization discussion at some point. The framework said yes, the team built it, and users shrugged.
This guide covers the seven prioritization frameworks product managers reach for most, when each one earns its place, and the failure modes no scoring spreadsheet will warn you about.
What prioritization decides
Prioritization is trade-offs, all the way down. New features compete with customer feedback, technical debt, and bug fixes for the same engineering weeks. Your job as a PM splits into three moves: estimate what each item costs, rank what each one returns, and select what makes the cut for the next cycle.
The Product Map prioritization guide frames the ranking criteria in five questions:
- Customer value: does this solve a real pain point, and how deep does it cut?
- Demand breadth: how many customers hit this problem, not how loudly one of them complains
- Strategy fit: does this move the product toward where the company is going?
- Financial impact: does it grow revenue, protect it, or cut cost?
- Effort: what will it take to build, in person-weeks, not vibes
One lens sits above all of them: value versus cost. High value, low cost wins. When a prioritization meeting goes sideways, returning to those two axes usually settles it.
.png)
Prioritization also inherits everything above it. Mission, vision, and strategy set the direction; goals and metrics make it measurable. A backlog scored without a strategy underneath it is a popularity contest with math on top.
Seven frameworks, explained
1. RICE
RICE, built at Intercom, scores each item as (Reach × Impact × Confidence) / Effort. Reach counts users affected per quarter. Impact scores the effect per user from 0.25 to 3. Confidence discounts guesswork, and effort is the denominator in person-months.
RICE rewards teams with real usage data and punishes wishful thinking through the confidence multiplier. One caveat for 2026: when AI agents make building cheap, effort stops being the brake it used to be. We covered how to rework RICE when building is cheap in a separate piece.
2. ICE
ICE strips the model down to Impact × Confidence × Ease, each on a 1 to 10 scale. It trades precision for speed, which makes it the right tool for growth experiments and marketing tests where you'll learn more from shipping than from scoring. It's also the easiest framework for beginners; you can score a backlog in an afternoon.
3. Value vs. effort matrix
Plot every item on two axes and you get four quadrants: quick wins (high value, low effort), major projects (high value, high effort), fill-ins (low value, low effort), and time sinks, which you kill without ceremony. No formula, no spreadsheet. For a startup product team with thin data, this matrix plus honest debate beats a precise-looking RICE score built on invented numbers.
.png)
4. MoSCoW
MoSCoW sorts scope into Must have, Should have, Could have, and Won't have. It comes from 1990s release planning, and release planning is still where it shines: fixed deadline, fixed team, what ships? Its weakness is inflation. Without a hard capacity cap, everything migrates into Must. Force a rule like "Musts consume no more than 60 percent of capacity" and the method holds.
5. Kano model
Kano classifies features by how they move satisfaction: must-be basics users expect, performance features where more is better, and attractive features that delight because nobody expected them. It also flags indifferent and reverse features, the ones users don't care about or dislike. Kano requires survey data from real customers, which makes it heavier to run but strong for deciding where delight is worth paying for.
6. WSJF and cost of delay
Weighted Shortest Job First, from SAFe, divides cost of delay by job size. Cost of delay combines user value, time criticality, and risk reduction. The question it answers is different from RICE's: not "what's most valuable?" but "what does waiting cost us?" That makes WSJF the strongest choice for enterprise product management, where regulatory deadlines and contract commitments carry real expiry dates.
7. Opportunity scoring
From Anthony Ulwick's outcome-driven innovation: survey customers on how important an outcome is and how satisfied they are with current solutions, then score Importance + (Importance - Satisfaction). High importance plus low satisfaction marks an underserved need, which is where B2B SaaS teams find differentiation their competitors' feature-copying misses. It's also the cleanest way to pull customer feedback into prioritization as numbers instead of anecdotes.
.png)
Story mapping deserves a mention alongside these seven. It doesn't rank a backlog; it arranges stories along the user journey so you can slice a coherent release. Use it to shape what a "priority" even is before you score anything.
How to choose the right framework for your backlog
Match the method to your team, not the other way around:
- Data availability: RICE, Kano, and opportunity scoring need real usage and survey data. Without it, use ICE or a value-effort matrix and upgrade later.
- Team maturity: a team new to structured prioritization should start with the easiest model it will consistently run. A simple framework used every sprint beats a sophisticated one abandoned by week six.
- Business context: startups optimize for learning speed, so ICE and value-effort fit. B2B SaaS teams balancing multiple customer segments get more from RICE or opportunity scoring. Enterprises with hard deadlines need WSJF.
- Decision type: discovery bets and delivery commitments deserve different scoring. Mixing them in one ranked list is how a risky experiment quietly displaces a contractual must-ship.
Most experienced teams run two frameworks: one for the quarterly roadmap discussion and a lighter one for sprint-level calls. The Product Management Map places prioritization among the competencies it connects to, if you want to see how it relates to roadmapping and discovery skills.
Where frameworks fail
Every framework fails the same few ways, and none of them show up in the spreadsheet.
Scores get treated as truth. A RICE score is a structured guess. Teams forget this the moment the number lands in a cell, then defend 47.5 versus 46.2 as if the decimal meant something. Use scores to sort items into rough tiers, then decide between neighbors with judgment.
The loudest stakeholder still wins. A framework only counters "loud voice syndrome" when scoring criteria are agreed before anyone pitches their pet feature. Set the weights first, in writing. Otherwise the discussion becomes reverse-engineering scores to justify a decision already made, which is slower than politics without the spreadsheet.
Nobody writes down the why. Six months later, someone asks why feature X beat feature Y, and the only artifact is a number. Document the reasoning behind each major call. It's what makes the trade-offs visible to stakeholders now and defensible later.
The scores never get revisited. Estimates decay. A confidence of 80 percent from January is fiction by June. Re-score the top of the backlog quarterly, and track whether shipped "high priority" items delivered the impact you scored them for. That delivered-versus-predicted gap is the honest ROI measure of your prioritization process, and it tells you when to switch frameworks: when predictions and outcomes stop correlating, the model is broken for your context.
A prioritization framework doesn't make the decision for you. It makes the disagreement visible enough for the team to decide.
The senior-operator blind spot most articles skip: framework theater. A team can run flawless RICE ceremonies while the real prioritization happens in a founder's DMs. If the ranked list keeps losing to overrides, fix the decision rights, not the framework. No scoring model survives an organization where the score doesn't own the outcome.
AI agents for prioritization
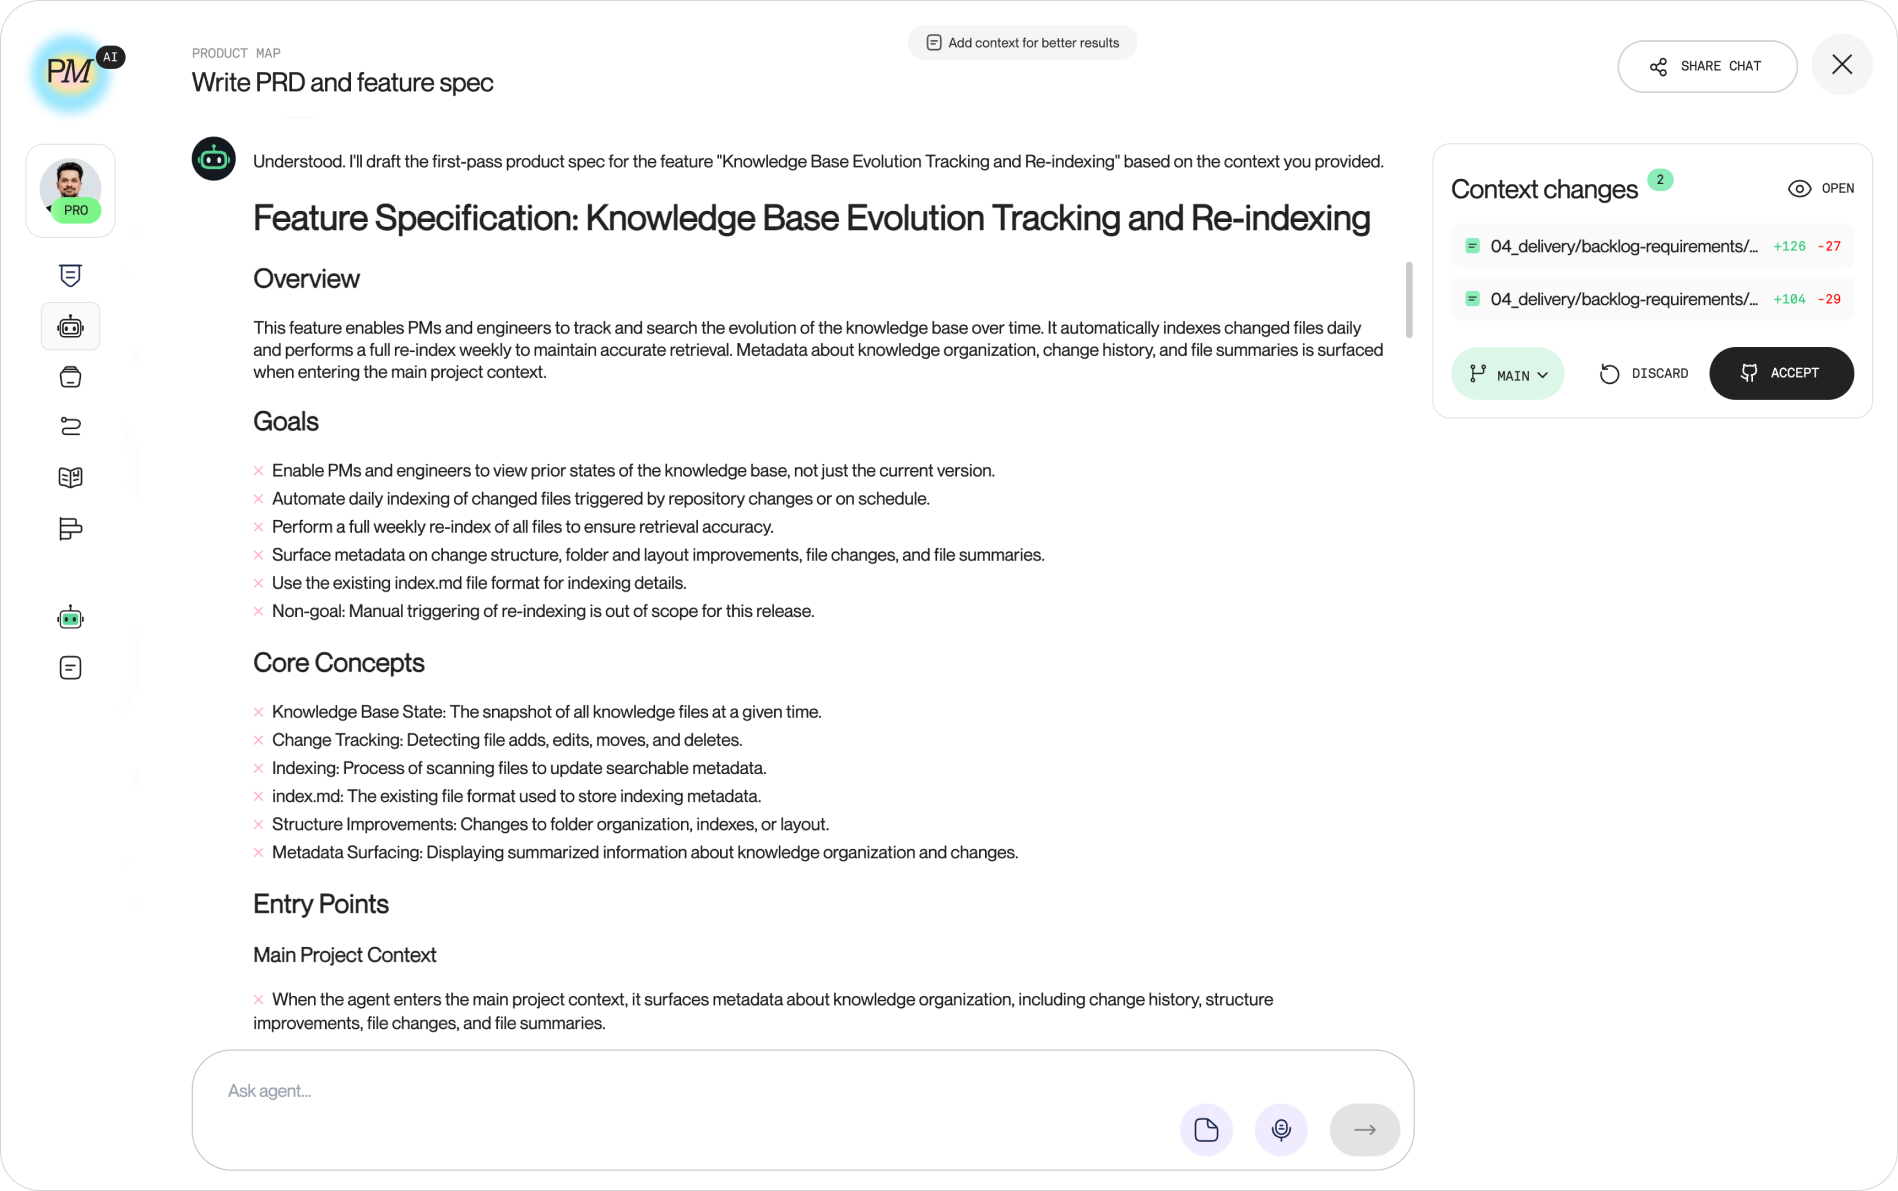
The mechanical part of prioritization, pulling items, drafting scores, flagging inconsistencies, is exactly the work AI handles well in 2026. Product Map's backlog prioritization agent takes your backlog, walks it through a framework, drafts Reach, Impact, Confidence, and Effort estimates with its reasoning attached, and returns a ranked list you review instead of a blank spreadsheet you fill.
.png)
The point isn't automation of the decision. The agent produces the first pass; you challenge the estimates, correct the reach numbers it can't know, and own the final ranking. That review loop is faster than scoring from scratch and more honest than gut feel, because every draft score arrives with an argument you can attack.
Prioritization also doesn't end at the ranked list. The top item needs a spec next, and the PRD AI agent picks up where the ranking stops: it drafts the requirements document for the feature you promoted, so the gap between "we decided" and "engineering can start" shrinks from days to an afternoon.
Pick one, run it, revisit it
Start with the simplest framework your data supports. Run it for a full quarter before judging it. Write down the why behind every top-ten call, and compare predicted impact against shipped results before you renew the framework's contract for another quarter.
The teams getting prioritization right in 2026 aren't the ones with the fanciest scoring model. They're the ones whose ranked list survives contact with stakeholders, ships in the order it promised, and learns from the gap between the score and what happened next.