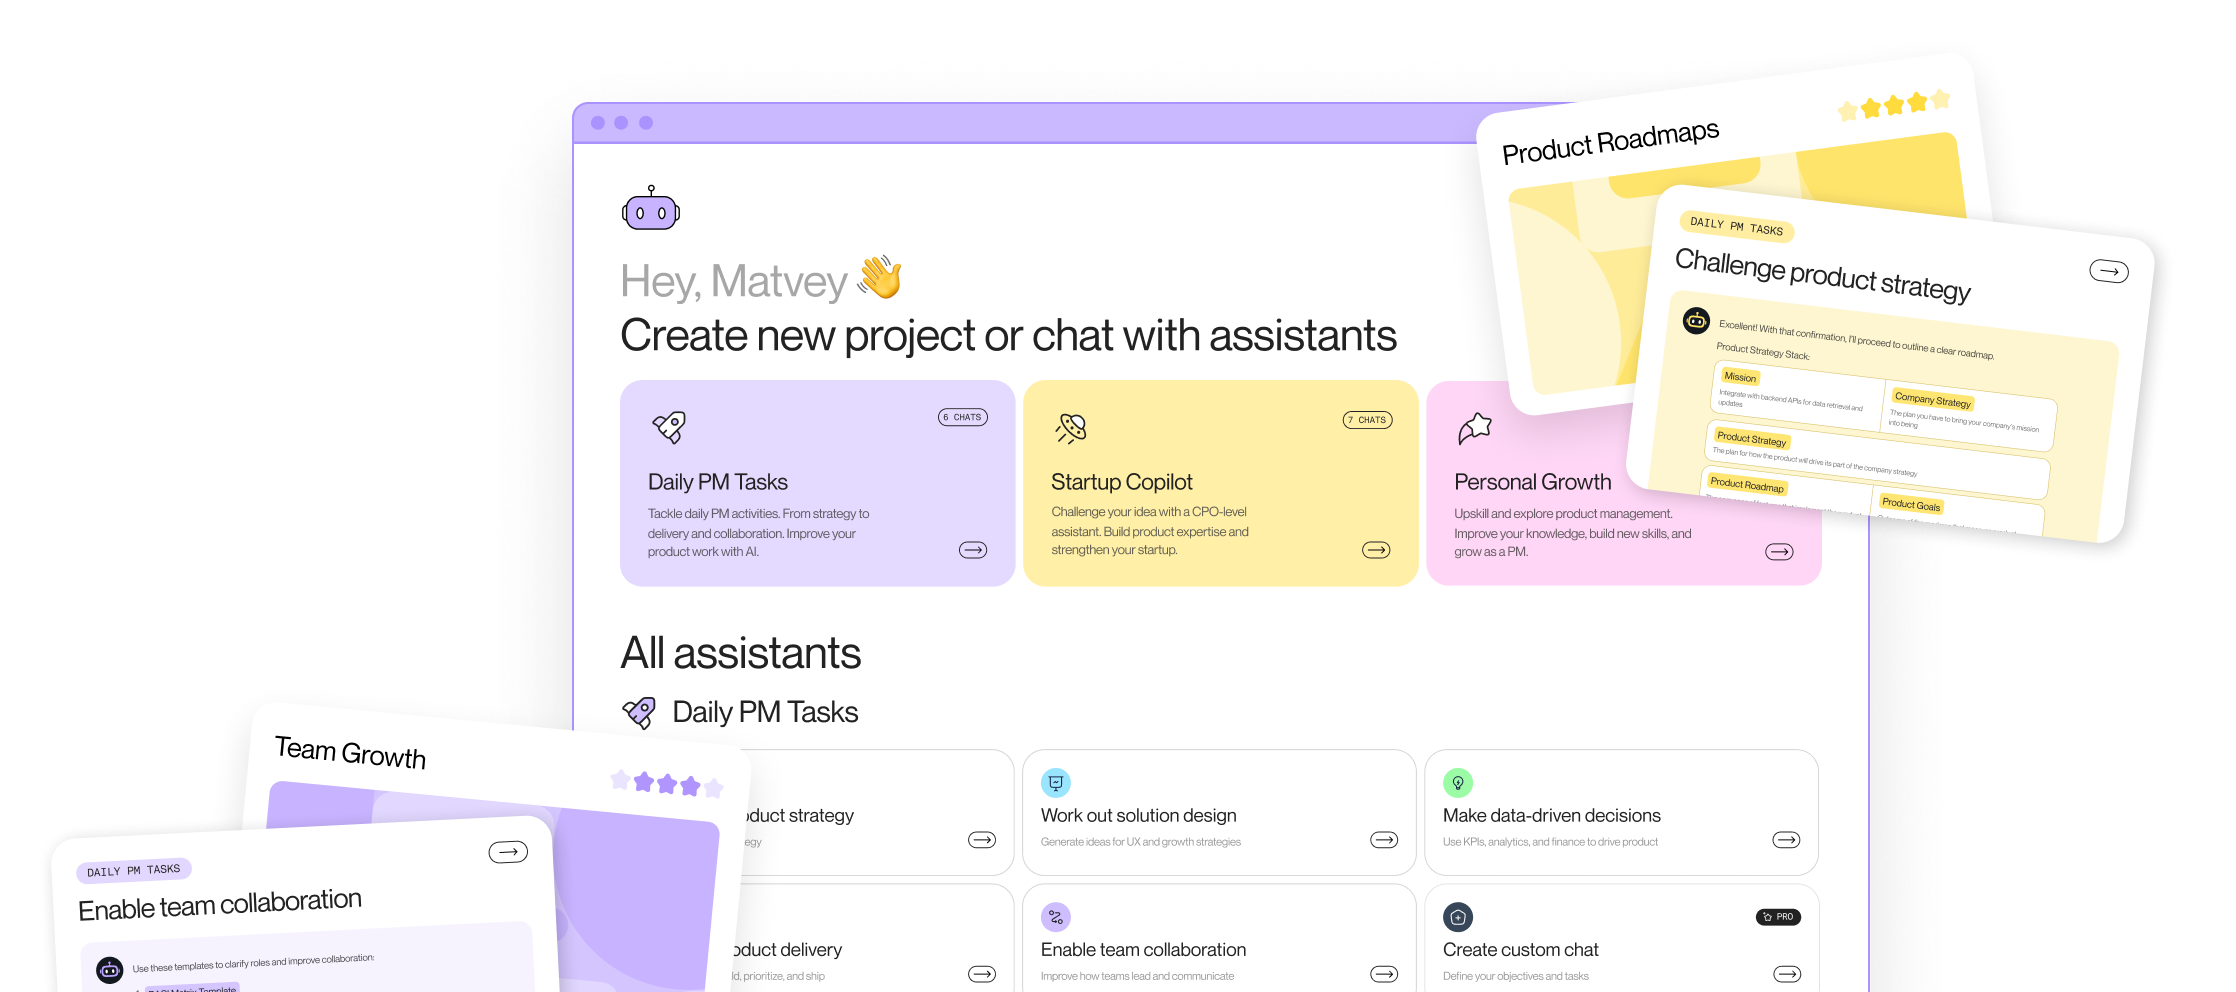





Ask Product Map for a unit economics model and the answer comes from one of three runtimes. In a Git repository it's the files under 03_analysis/unit-economics/. In an editor it's a Claude Code skill triggered by "check our LTV:CAC." On the platform it's the system prompt behind the unit economics agent. The chain of metrics and the benchmarks stay identical across all three; only the delivery format differs.
Unit economics made that trade earlier than most PM artifacts, because its formulas were settled long ago. LTV, CAC, payback, and contribution margin still mean what David Skok's essays said they meant. What moved is the carrier.
For years the model was a spreadsheet whose definitions lived in one founder's head. An agent now reads the file, fills the gaps with assumptions it labels, and runs the pessimistic case before the deck is open, so the place the file sits decides whether those definitions outlive the person who typed them.
The sections that follow take the chain of metrics worth keeping, the lines a model inside the product adds to it, the complete markdown file to drop into your repo, and the tradeoffs between spreadsheet, skill, and hosted agent.
The classic unit economics chain, from UA to margin
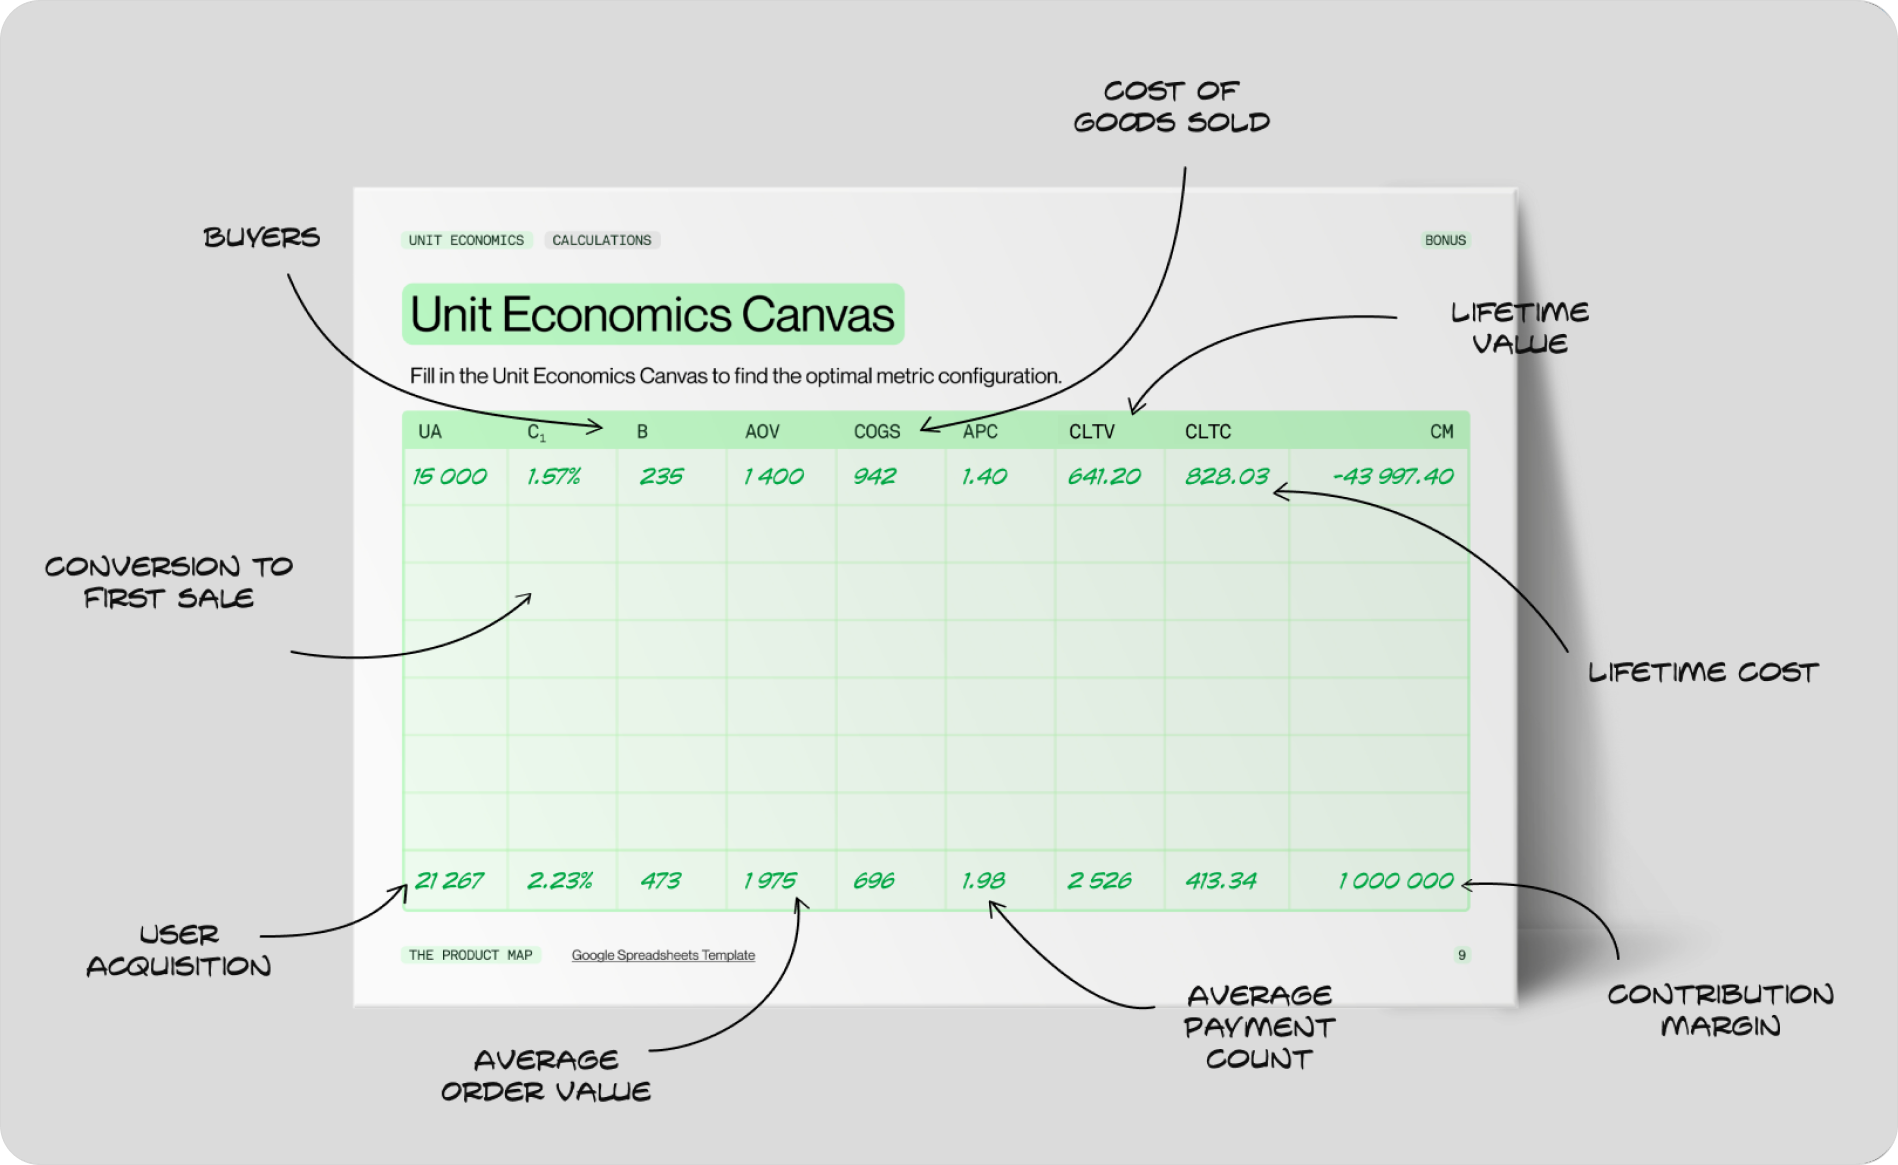
Product Map's template follows the model Daniil Khanin built for the Unit Economics Handbook, which extends Skok's LTV and CAC pair into a full chain: UA, C1, B, AOV, COGS, APC, LTV, LTC, CM. Every step is a metric you can measure, and every step feeds the next one.
- UA, user acquisition: people who entered the funnel in the period. Unique visitors from ads for e-commerce, new CRM records for B2B.
- C1, conversion to first sale: buyers divided by users acquired, so C1 = B / UA. Skipping it is the most common inflation in startup decks.
- AOV, average order value: revenue per transaction. For SaaS, plan price times seats.
- COGS and 1sCOGS: the variable cost to deliver one transaction, plus the extra cost of a customer's first one: onboarding, setup, migration. 1sCOGS sits in delivery, not marketing.
- APC, average payment count: transactions divided by buyers, so APC = T / B. For subscriptions it's the number of months a customer keeps paying, which makes it the retention metric in disguise.
- CPA and CAC: marketing spend per acquired user, and per paying customer. CLTC adds retention spend over the customer's life, and LTC = CLTC × C1 brings it back to the per-user basis.
Three calculations chain the inputs together. CLTV = (AOV - COGS) × APC - 1sCOGS is gross profit per customer. LTV = CLTV × C1 is gross profit per acquired user. CM = UA × (LTV - LTC) is the contribution margin of the whole cohort, and it has to cover fixed costs before anything reaches EBITDA.
If the unit is ambiguous, every ratio downstream of it is meaningless.
Two separations carry most of the template's discipline. The first is per customer versus per acquired user: CLTV describes a buyer, LTV describes everyone you paid to bring in. Compare a per-customer value against a per-user cost and you've multiplied your ratio by 1 over C1 without noticing. At a 5 percent conversion rate, that's a twentyfold error.
The second is margin basis. LTV on gross margin and payback on contribution margin are two different models wearing the same label. Pick one, write it at the top of the file, and use it in every formula below. The unit economics calculation topic walks through each metric with its formula and sources.
What changes in the model when AI sits in the product
A classic SaaS template assumes COGS is flat. Hosting per account costs about the same whether a user logs in once or a hundred times, so gross margin lands between 70 and 80 percent and stays there. A model inside the product breaks that assumption in the one place the template is least prepared for it.
Every generation, retrieval, and tool call costs money per use. An assistant at four cents per interaction with a heavy user firing 600 interactions a month costs $24 against a $20 seat, before infrastructure or support. The AI margin trap is that the distribution hides it: most users are light, a thin tail is heavy, and the average COGS on the dashboard looks fine while the top accounts invert.
The additions worth making to the template:
- COGS at p50 and p95, not an average: tokens per task times price per token, at the median and the 95th percentile, times tasks per account per month. The p95 line is the one finance needs.
- Break-even usage per account: the number of tasks per month at which an account's inference cost equals its price. Every account above it is a loss until pricing or gating changes.
- 1sCOGS with onboarding inference: indexing a workspace or embedding a document set at signup is a first-transaction cost, and often the largest single inference bill a customer ever generates.
- Model price sensitivity and margin by plan: a row showing gross margin at minus 50 and plus 50 percent provider price, and a line per plan, because a bundled per-seat feature and the same feature metered carry different margins. Pricing structure is a unit economics input now, which is the argument against per-seat pricing for agent features.
An AI feature is the first line in COGS that grows with how much customers love you.
The rest of the chain still holds. What changed is that a product manager now owns a COGS line, and the template has to make it visible at the account level, not only in the quarterly finance pack.
The copy-paste unit economics template, in markdown
The full template below is the classic chain plus the AI cost addendum. Paste it into your repo as unit-economics-model.md, delete the addendum for products with no model inside, and keep the headings verbatim so agents and humans fill the same structure. Mark every input with one of three bases: measured, assumed, or benchmark.
# Unit Economics Model: [Product / Segment / Channel]

> Status: [draft / reviewed] | Period: [YYYY-MM to YYYY-MM] | Owner: [name] | Updated: [YYYY-MM-DD]

## Definitions

[Freeze these before entering a single number. Every formula below uses them.]

- Unit: [account / seat / order / subscriber / seller / buyer]
- Segment and channel this model covers: [e.g. SMB, paid search + organic]
- New customer means: [first paid conversion; trials and reactivations excluded]
- Revenue basis: [recognized / billed / booked]
- Margin basis: [gross / contribution], used in LTV and payback alike
- Churn measured on: [logos / revenue]; expansion in LTV: [yes / no]
- Time window: [monthly / quarterly]; attribution lag: [n days]
- Data sources: [billing export, CRM, ad platforms], linked under 10_data/

## Inputs

[Basis for each value: measured, assumed, or benchmark. Never leave basis blank.]

| Metric | Definition | Value | Basis | Source or assumption |
|--------|------------|-------|-------|----------------------|
| UA | Users acquired in period | | | |
| B | Buyers (first paid conversion) | | | |
| C1 | B / UA | | | |
| AOV | Average order value per transaction | | | |
| COGS | Variable cost per transaction | | | |
| 1sCOGS | Extra cost of the first transaction (onboarding, setup) | | | |
| APC | Transactions per buyer over lifetime (T / B) | | | |
| CPA | Marketing spend / UA | | | |
| CAC | Acquisition spend / B | | | |
| CLTC | CAC + retention spend per customer over lifetime | | | |
| Fixed costs | Per period, not attributable to units | | | |

## Calculations

- CLTV = (AOV - COGS) x APC - 1sCOGS = [ ]
- LTV = CLTV x C1 = [ ]
- LTC = CLTC x C1 = [ ]
- CM = UA x (LTV - LTC) = [ ]
- Monthly contribution per customer = (AOV - COGS) x payments per month = [ ]
- CAC payback (months) = CAC / monthly contribution per customer = [ ]
- LTV:CAC = CLTV / CAC (per customer) or LTV / CPA (per user); never mix bases = [ ]
- Break-even: CM [ ] vs fixed costs [ ] -> [covered / shortfall of ...]

## Benchmarks

[Hypotheses for your segment, not laws. Pair every ratio with payback and retention.]

| Metric | Benchmark | Current | Gap |
|--------|-----------|---------|-----|
| LTV:CAC | >= 3:1 (far above may mean underinvestment) | | |
| CAC payback | < 12 months (6 to 9 is fast) | | |
| Gross margin | 70 to 80% for SaaS; lower with inference COGS | | |
| Activation rate | > 60% for freemium | | |
| Net revenue retention | 100 to 120%+ | | |

## Bottleneck

[Theory of Constraints: one step at a time. Fix the constraint, then re-run.]

Chain: UA -> C1 -> B -> AOV -> COGS -> APC -> LTV -> LTC -> CM

| Step | Current | Target | Gap | Constraint? |
|------|---------|--------|-----|-------------|
| | | | | |

- Single biggest bottleneck: [step]
- Why this step and not the next one: [evidence]
- Actions on this step only (3 to 5): [action, expected metric move]

## Stress Test

| Scenario | Change | LTV | CAC | LTV:CAC | Payback |
|----------|--------|-----|-----|---------|---------|
| Base | as modeled | | | | |
| Churn up | APC -20% | | | | |
| Acquisition up | CAC +30% | | | | |
| Price down | AOV -10% | | | | |
| Delivery up | COGS +15% | | | | |
| Combined pessimistic | all four | | | | |

- Levers ranked by speed toward 3:1: 1. [ ] 2. [ ] 3. [ ]

## AI Cost Addendum

[Use when the product calls a model. Delete for products with no inference cost.]

- Tokens per task: p50 [ ] / p95 [ ] x price per token = $[ ] / $[ ] per task
- Tasks per active account per month: p50 [ ] / p95 [ ]
- Inference COGS per account per month: p50 [ ] / p95 [ ] (feeds COGS above)
- Break-even usage: [n] tasks per month at the current price
- Accounts above break-even usage: [ ]% of actives, [ ]% of revenue
- Onboarding inference in 1sCOGS (indexing, imports, embeddings): $[ ]
- Cost controls: [credits / caps / hybrid floor]; kill switch owner: [name]
- Model price sensitivity: gross margin at -50% / +50% provider price: [ ] / [ ]
- Gross margin by plan: [plan: margin]

## Improvement Plan

| Lever | Metric moved | Expected LTV:CAC after | Owner | Due (YYYY-MM-DD) |
|-------|--------------|------------------------|-------|------------------|
| | | | | |

## Cohort Appendix

[Blended numbers for the portfolio view; cohorts for diagnosis.]

- Retention curve by signup month: [link]
- CAC, payback, LTV:CAC by channel and plan: [link or pivot spec]
- Blended vs cohort delta and why: [ ]
Install the model as a skill in every agent you use
The template is plain markdown, so it runs on any agent stack your team already uses. Three steps take it from a file in a folder to the way every unit economics question gets answered:
- Create a skill from the template. Wrap the file in a skill or custom instruction for your model of choice: Claude Code, Codex, Gemini, or Microsoft Copilot. Keep the skill thin. Point it at the template, require the definitions header before any calculation, require a basis label on every input, and allow collapsing a section only with a one-line reason.
- Execute the skill against real exports. Drop the billing and ad-spend exports under
10_data/, type "build our unit economics model for the SMB segment," and the agent scaffolds the file, fills measured inputs from the data, marks the rest assumed, computes the chain, and runs the stress test. The result is a dated markdown file next to its evidence, not a chat transcript you copy numbers out of. - Set it as the structure every forecast starts from. Register the same template in the other tools your team models in, so the revenue forecast, the pricing proposal, and the board deck all read the same definitions. The handoff to finance or investors becomes the file itself: one unit, one margin basis, one set of numbers.
Pick where the model runs
Decide the runtime before you argue about benchmarks. If your team already works in editors with coding agents, commit the template to a shared repo and wrap it in a skill; the review discipline comes free with the pull requests. If you want the interviewing behavior without any setup, type your price, your CAC, and your retention into the Product Map unit economics agent and watch which assumption it asks you to confirm first.
Either way, the model stops being a spreadsheet one person understands. It becomes the shared contract between you, your finance lead, and every agent producing numbers on your behalf.
Spreadsheet, skill, or agent: three ways to run it
Most unit economics articles stop at the formulas. The same model behaves differently depending on where it runs. Product Map runs it in all three formats, and each one fails in its own way.
The spreadsheet you fill in
The classic mode: download the Unit Economics Canvas from the handbook, or the Google Sheet behind it, and type in your numbers. It costs nothing, works in any finance tool, and a spreadsheet does arithmetic better than any prose template.
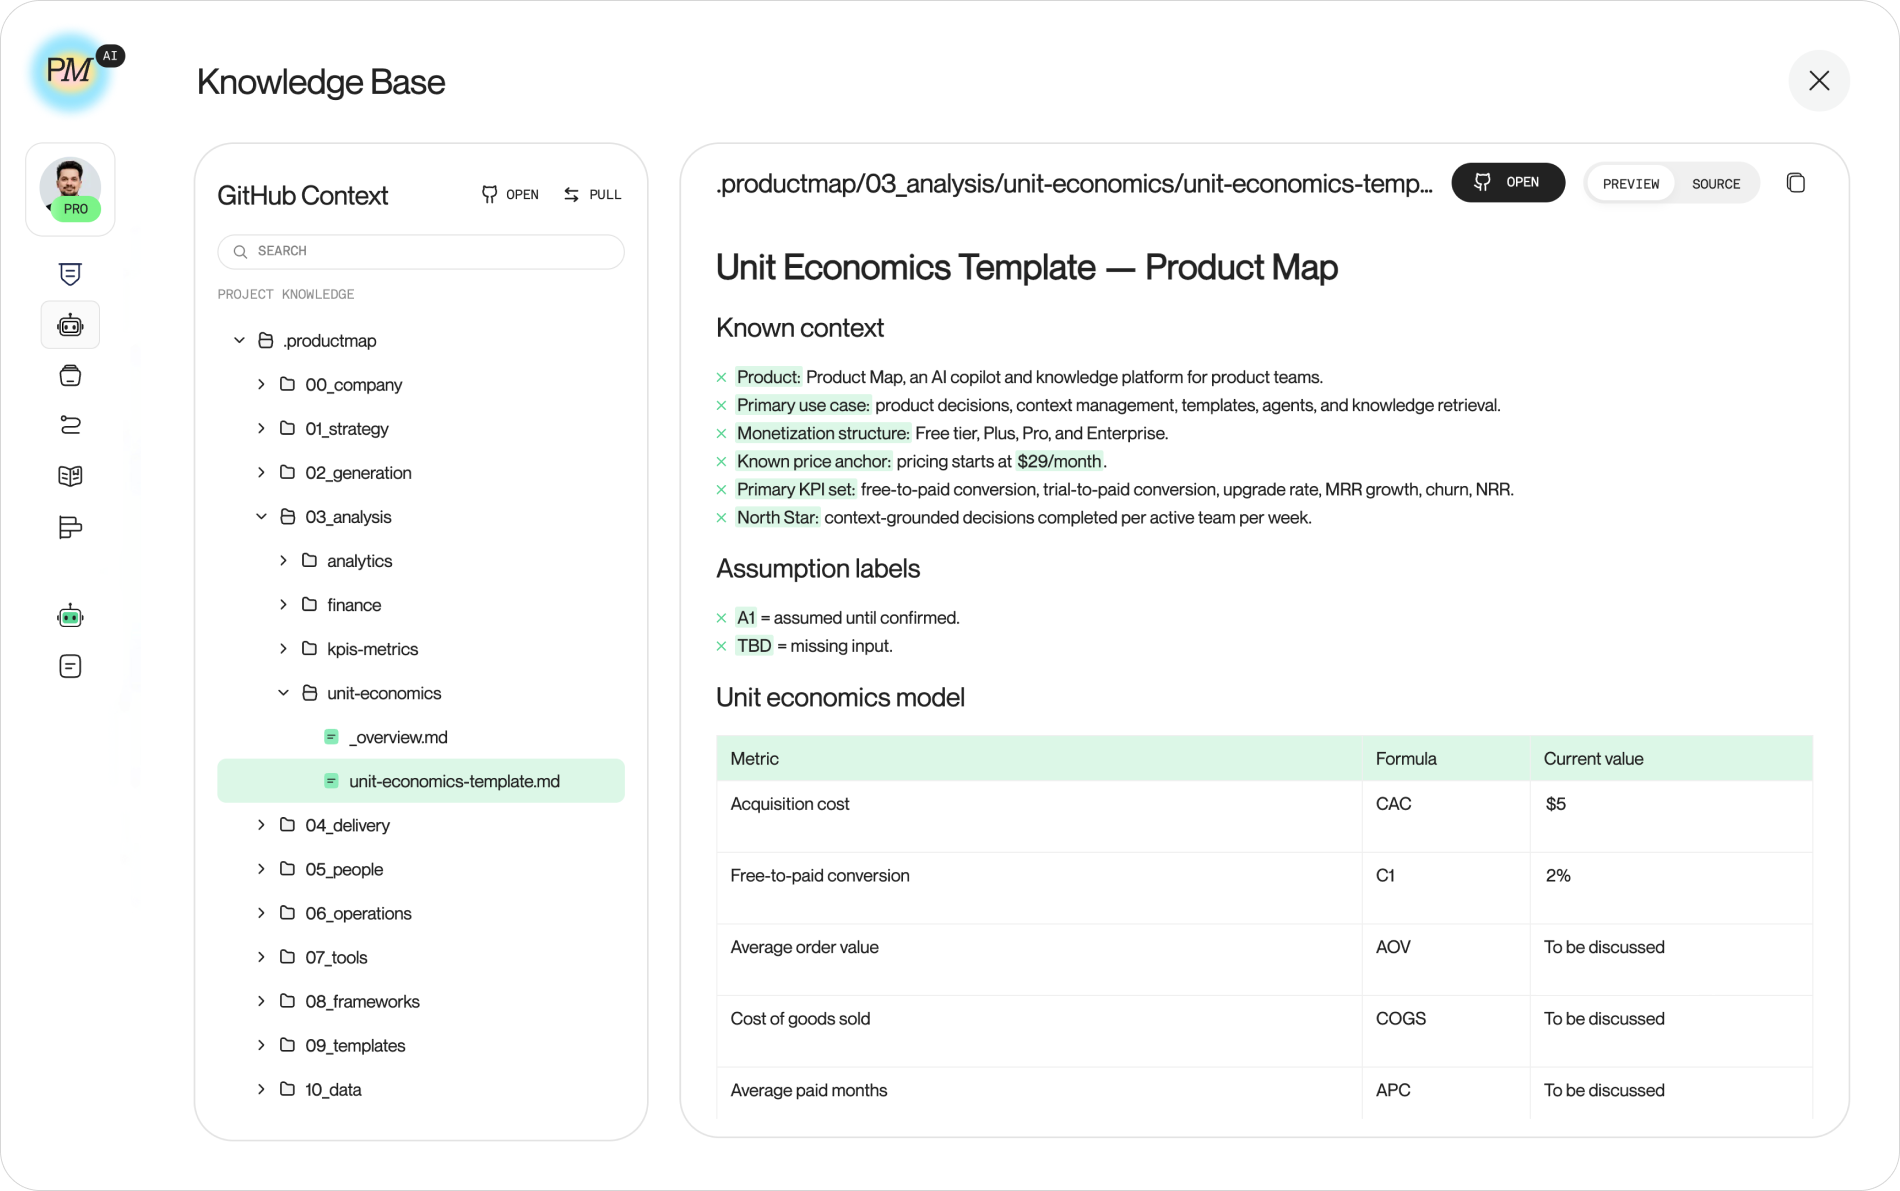
The weakness is definitions. The sheet holds the numbers and the founder's head holds what they mean. CAC on paid channels only, LTV on bookings, churn measured on logos because that's what the billing export had. Six months later a new hire reopens the file and computes a different ratio from the same cells. In a product context repository the equivalent lives under 03_analysis/unit-economics/ as three markdown files: an overview, an LTV:CAC model, and a contribution margin analysis, each with the definitions written next to the numbers.
The skill beside your data
The second mode versions the template like code. The canonical file lives in the shared repo, and a Claude Code skill teaches the agent when it applies (LTV:CAC, payback, contribution margin, burn multiple, "is this business viable") and how to proceed: define the unit, freeze definitions for new customer and revenue and margin, build the baseline with explicit time windows, layer cohort views over the blended numbers, stress-test, pick 3 to 5 levers with owners and dates, and write the artifact with links to the raw exports under 10_data/.
The skill also insists on a data dictionary before any calculation: which customer ID, which MRR definition, whether trials count, how multi-product revenue splits. Its own line on this is the most useful sentence in the file.
Most unit economics debates are join-key debates.
Now "check our unit economics" in your editor produces a dated markdown file next to the exports it was computed from, and a template fix ships as a pull request to every future model on the team. The cost is setup: a repo, a skill file, and a team comfortable working where the agents work. The product context repository guide covers that setup.
The agent that interviews you
The third mode packages the template inside a hosted agent. Product Map's unit economics agent wraps the same model in a system prompt with an operating contract, and the contract is more interesting than the formulas.
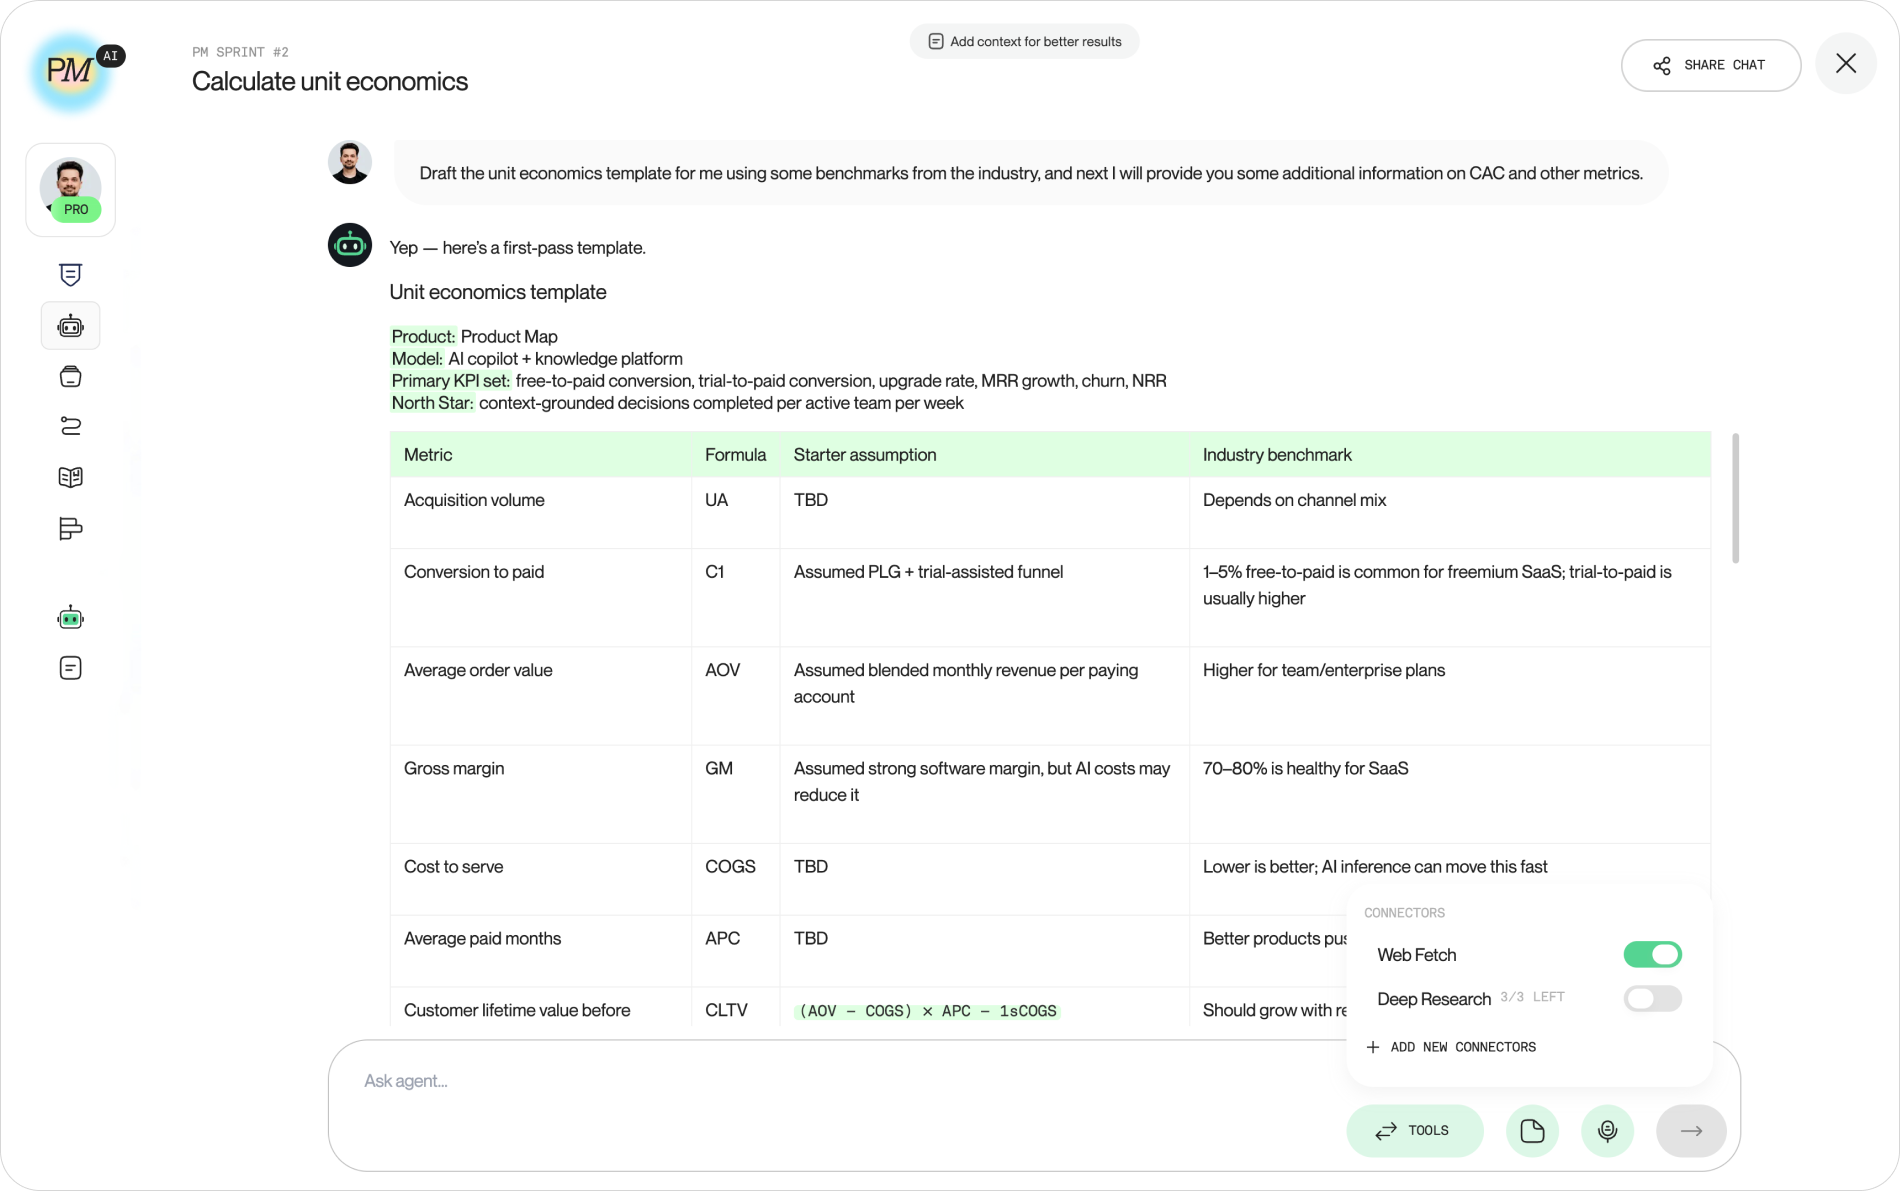
The agent asks at most two questions before producing anything: what the product does, who pays, and the pricing model. Then it drafts the full template immediately, filling every missing input with a labeled assumption the founder can correct. After the draft exists it collects the real inputs one at a time, CAC, AOV, COGS, APC, and C1, and re-shows the template after each answer. Once the model is complete it computes CLTV, LTV, LTC, and CM, places LTV:CAC against the 3:1 benchmark, and names the single most critical gap.
Then it does the two steps founders skip. It walks the chain with the Theory of Constraints, names one bottleneck, and proposes 3 to 5 actions aimed at that step alone. And it re-runs the model with pessimistic inputs, higher churn, lower AOV, rising CAC, and ranks which lever moves LTV:CAC toward 3:1 fastest. The output is three files it maintains across sessions: unit-economics-model.md, ltv-cac-analysis.md, and improvement-plan.md.
Draft first, refine after. Show a template with assumptions instead of asking five questions upfront.
Zero setup, and the interviewing behavior is the point: the agent carries the discipline, so the output stops depending on whether the founder remembered to separate CLTV from LTV. The tradeoff is context. A hosted agent knows what you tell it and what your connected project provides; a repo skill sits inside the full knowledge base by default.
Four habits the agent's prompt forces on the model
Reading the prompt behind the agent exposes decisions a spreadsheet leaves implicit. Four of them transfer to any unit economics template, in any format.
Label every assumption. The prompt requires a filled template after two questions, which means most cells start as guesses. The rule is not "guess less." The rule is that every guess carries a label the user can see and overwrite. An unlabeled assumption becomes a fact in the next board deck, and nobody remembers it started as a placeholder.
Order the chain so the constraint is findable. The prompt lists the metrics in flow order, UA to CM, because the Theory of Constraints only works on a sequence. A template listing metrics alphabetically, or grouping them by department, can't tell you that activation is capping everything downstream. One bottleneck at a time, then the next one.
Make the stress test a section, not a follow-up. Churn plus 20 percent, CAC plus 30 percent, price minus 10 percent, COGS plus 15 percent. The skill hardcodes those four, and the agent runs its own pessimistic pass before the summary. A model existing only in its base case is a pitch, not a model.
Treat benchmarks as hypotheses. 3:1 is a sanity check from Skok's SaaS data, and the improvements topic is explicit that a ratio far above it can mean underinvestment in growth. Payback under 12 months, with 6 to 9 months counting as fast. Gross margin 70 to 80 percent for SaaS. Net revenue retention above 100 percent. Pair every benchmark with payback and retention quality, because LTV:CAC alone rewards whoever picked the longer horizon.
The operator blind spot in all this is the one investors catch first. The most common unit economics failure in a fundraising conversation is not a bad number. It's two good numbers computed on different bases: cash CAC from the ad platforms against bookings LTV from the CRM, with a 3.4:1 printed underneath. The second most common is a healthy ratio at a company with six months of history, where the churn producing the real APC hasn't happened yet. Neither shows up in a spreadsheet. Both show up the moment a definitions header is mandatory, which is why the template above starts with one, and why the agent re-shows the model every time it recalculates.
One more consequence of running the template as a skill or a prompt: editing it ships a behavior change to every agent reading it. Switching the default margin basis from gross to contribution changes every payback number the team produces next week, with no review and no changelog unless the file lives in version control. Treat the template like a prompt, because it is one: one owner, a pull request, and a dated entry when the benchmarks move.
Alternative unit economics templates and calculators
The template above is one credible way to model a unit. Four alternatives shape how teams do it, and each carries a different theory of what the model is for.
- Skok's SaaS metrics essays: the origin of the 3:1 ratio and the 12-month payback rule. Startup Killer: the Cost of Customer Acquisition and SaaS Metrics 2.0 define LTV, CAC, and payback with the derivations most later templates copied. The idea: a SaaS business is a machine for turning acquisition spend into recurring margin, and two numbers tell you whether the machine works.
- Khanin's Unit Economics Canvas and ueCalc: the one-page canvas from the handbook lays the UA-to-CM chain out visually and runs the same formulas with scenario inputs. The idea: unit economics is a funnel with costs attached, not a pair of ratios, so model the whole flow and the ratios fall out.
- Cohort spreadsheets: the StartupTools Google Sheet listed on the calculation topic computes CLTV and CAC from monthly cohort data instead of a geometric churn approximation. The idea: the retention curve is the model, and any formula assuming constant churn is a placeholder until the curve exists.
- Lever lists: Boaz Lantsman's tactics spreadsheet, linked from the improvements topic, is a catalog of ways to move each metric, not a model. The idea: once you know the bottleneck, the hard part is choosing the action, so keep the options next to the numbers.
None of these conflict with the three runtimes framing. Each is plain text or a sheet, which means each can run as a document you fill in, a skill your agent loads, or a prompt behind a chat interface. The difference is emphasis: Skok optimizes for the investor conversation, the canvas and the cohort sheet optimize for diagnosis, and the template in this article optimizes for the handoff, where an agent needs the definitions, the inputs, and the stress test assembled in one executable file.