




Pear VC surveyed 30 investors on how they judge a startup's scale and published an awkward finding: many of them don't know the exact definitions of TAM, SAM, and SOM either. The acronyms survive on pitch slides because everyone expects them, not because anyone trusts them. The same guide tells founders to skip the labels and show a bottom-up estimate instead.
That advice lands in a year when a market number costs nothing to produce. Ask any model to size your market and it returns three nested circles and a headline figure with a "B" behind it.
Waveup, which has worked on more than 500 decks, reports 70 percent of first-pass rejections in its work cite an unclear market size. The slide got faster to make. It didn't get more believable.
The fix is a division of labor. A bottom-up model is a short multiplication: customers who fit, times what each pays, times how often they pay. AI is good at filling and sourcing each of those inputs. You are the only one who can own the assumptions between them. This how-to covers the chain, the two corrections 2026 forced on it, the caveats block most decks skip, and Product Map's pass on its own market.
Why the AI-made TAM slide gets a nod and no term sheet
A model asked for "the market size for an AI product management copilot" finds analyst reports, picks the largest defensible category, applies a percentage, and writes it up with confidence. Every step is reasonable. The sum is worthless to an investor, for three reasons.
- The inputs are hidden. A headline figure carries no customer count, no price, and no frequency. There's nothing to argue with, so a partner nods.
- The category is borrowed. "Corporate training, $391 billion" is a real number from Training Industry. It's also a category your product touches at one edge. Taking a percentage of it is the top-down move investors have learned to discount.
- The staleness is invisible. Analyst figures for AI productivity tools ranged from $9 billion to $25 billion for the same year. The model picks one and presents it as settled.
The fastest way to lose a VC in 2026 is to present a $100B TAM without a bottom-up check.
That line is Waveup's, and it matches what Pear VC heard from its 30 investors: stop projecting revenue as a share of a large market. Bottom-up is slower, harder to fake, and, in Qubit Capital's phrasing, "the only type that truly matters to investors." The question is where in the chain to let AI work.
Top-down sets the ceiling, bottom-up sets the number
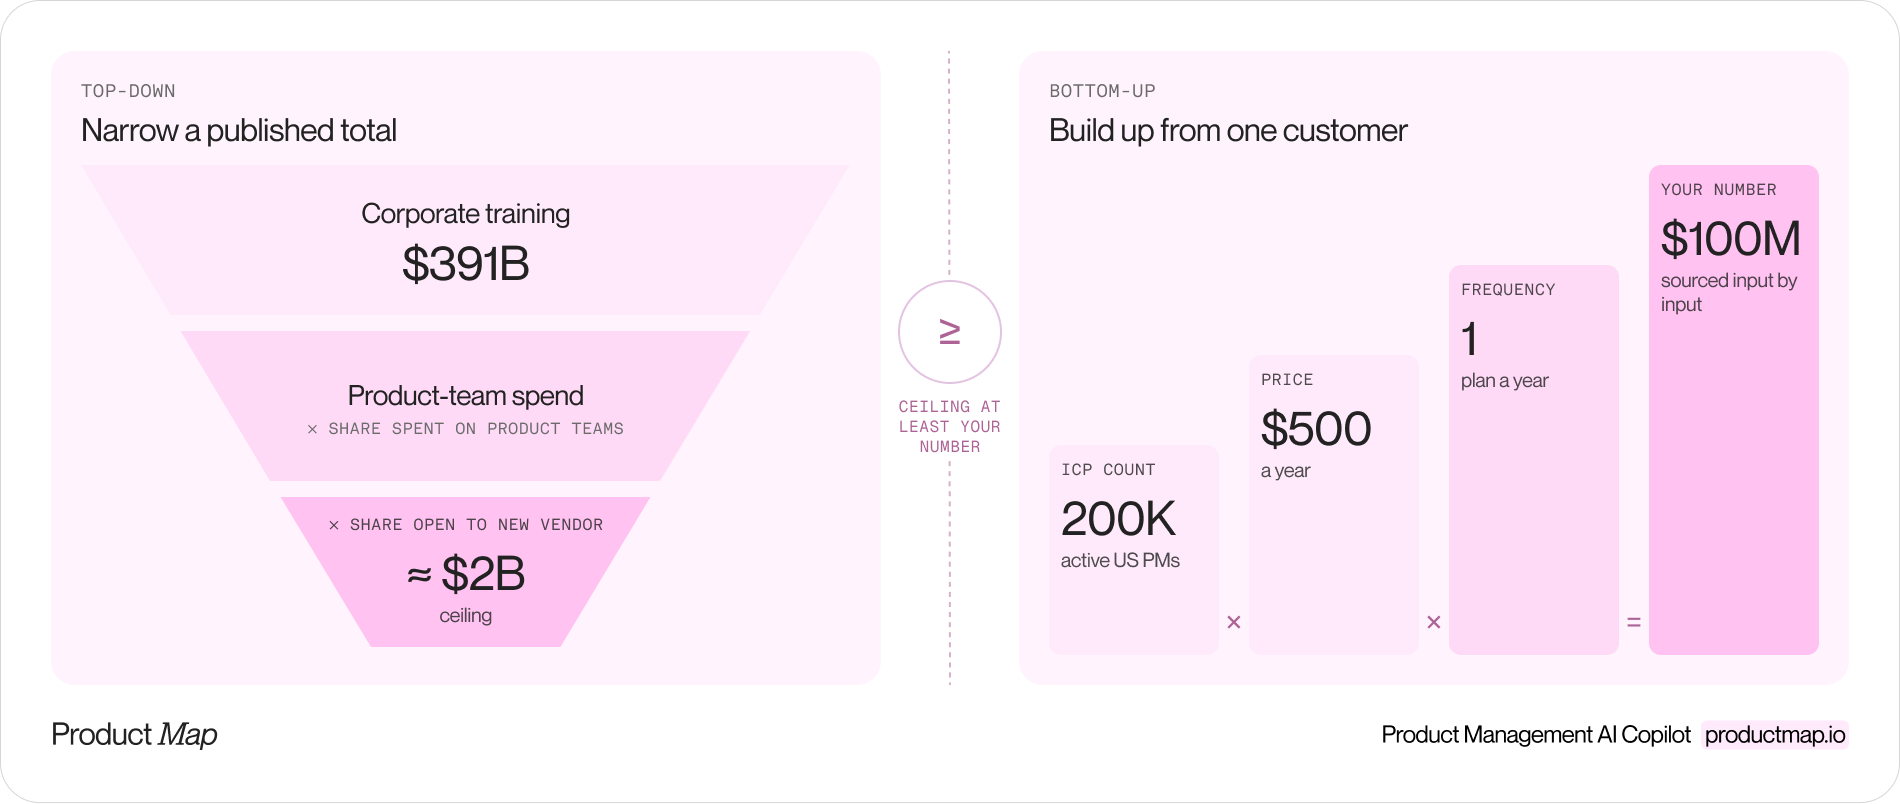
The two methods answer different questions, and a deck needs both. Top-down starts from a published total and narrows: the corporate training market, the share spent on product teams, the share open to a new vendor. It tells you the ceiling. Its one job is sanity-checking the magnitude of your bottom-up figure. If bottom-up lands above top-down, one of them is wrong, and it's usually the bottom-up price or count.
Bottom-up starts from a customer and scales up. Qubit Capital's example is a hospital software company: 175 target hospitals, 80 doctors each, $3,500 per doctor per year, so a $49 million market. A partner can ask why 175 and not 400, and you can answer.
Show both on the same slide. Bottom-up convinces because its assumptions are substantiated elsewhere in the pitch, in the customer definition, the revenue model, and the go-to-market plan. Top-down beside it proves you know the ceiling and chose a number underneath it.
Build the bottom-up chain one sourced input at a time
Give the model one input at a time, ask for the source with every figure, and open the source before the number goes in the file. Run the session with your product context loaded, so the model knows the segment, pricing, and geography you've committed to.
Step 1: Count ICP accounts
The first input is the count of accounts or people who match your ideal customer profile, not the count of everyone who could conceivably use the product. Prompt the model for the population estimate, then for the two or three sources behind it, then for the spread between them.
That spread is the point. For product managers, LinkedIn-derived counts put active employed PMs near 1 million, self-identified PMs near 2.4 million, and a McKinsey forecast reaches 3 to 4 million by counting roles outside tech. A fourfold gap. The model will happily pick the biggest number. You pick the floor for SAM and a midpoint for TAM, and you write down why.
Step 2: Anchor the price to what substitutes charge today
Ask the model for the published prices of the five closest substitutes, with links. A willingness-to-pay figure bracketed by real list prices is an assumption an investor can test. For a PM copilot, the anchors ran from a $150-a-year creator bundle through a $228-a-year AI PRD tool to Reforge's $1,995 membership. A blended $200 to $700 a year per person sits inside that range and can be defended line by line.
For team contracts the anchors change: what Productboard quotes for twenty makers, what a cohort program charges per seat. Same method.
Step 3: Set frequency from retention benchmarks, not hope
Frequency turns a price into annual revenue. For a subscription it's the months a customer stays in a year. For a one-off purchase it's how often the trigger recurs. Lenny Rachitsky's retention surveys give SaaS benchmarks by segment. Use the one for a company at your stage, not the best-in-class number.
Step 4: Haircut for reach
Multiply the three inputs and you have a serviceable market, not an obtainable one. Cut it for language, for geography you can't sell into, and for accounts locked to an incumbent. In the Product Map pass, 55,000 companies with five or more PMs times a $15,000 contract gave $825 million, and an estimate of 30 percent open to a non-incumbent vendor cut it to $250 million. The 30 percent is an assumption. It's in the caveats, with a name next to it.
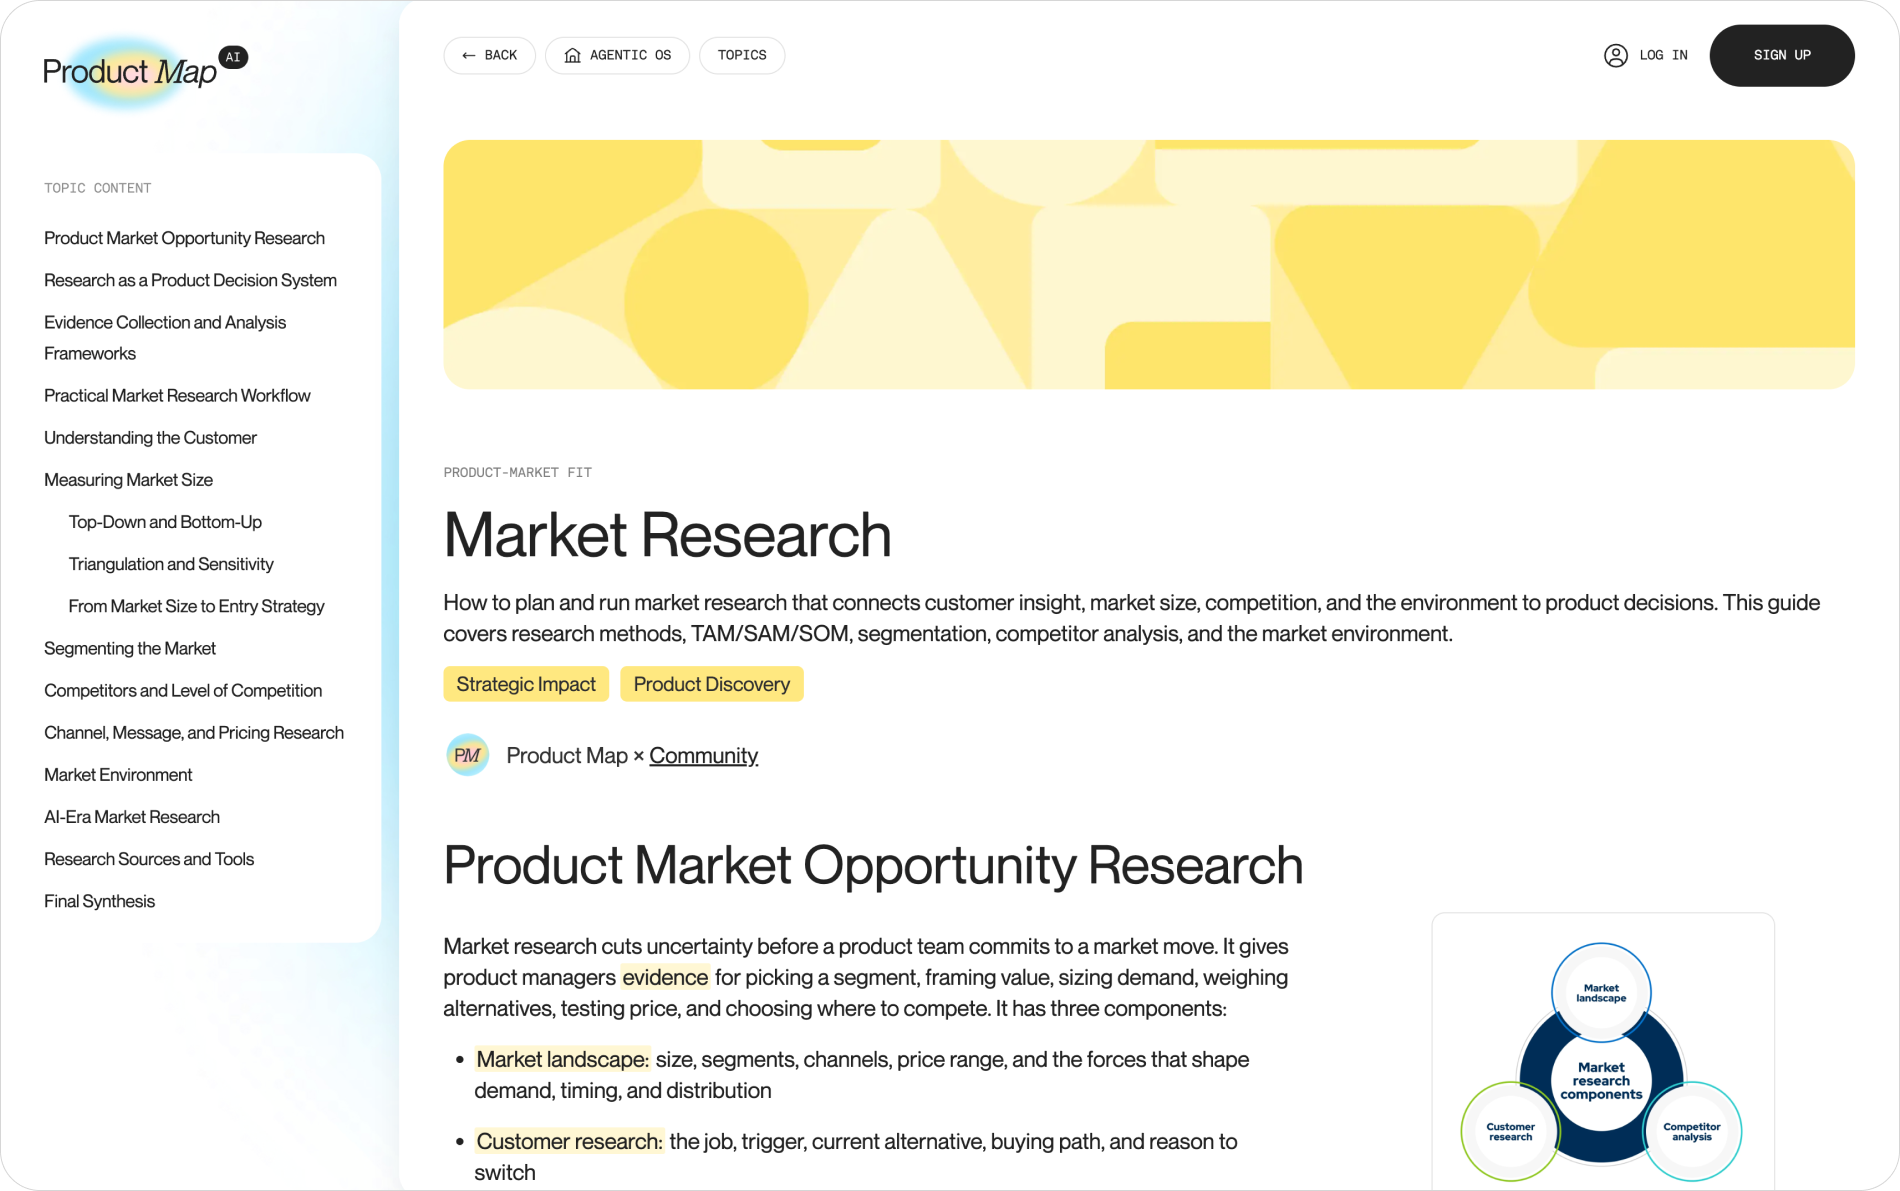
The Market Research topic on Product Map holds the sizing framework and the sources used above, and the Startup idea validation agent runs the chain against a one-pager in a product context repository.
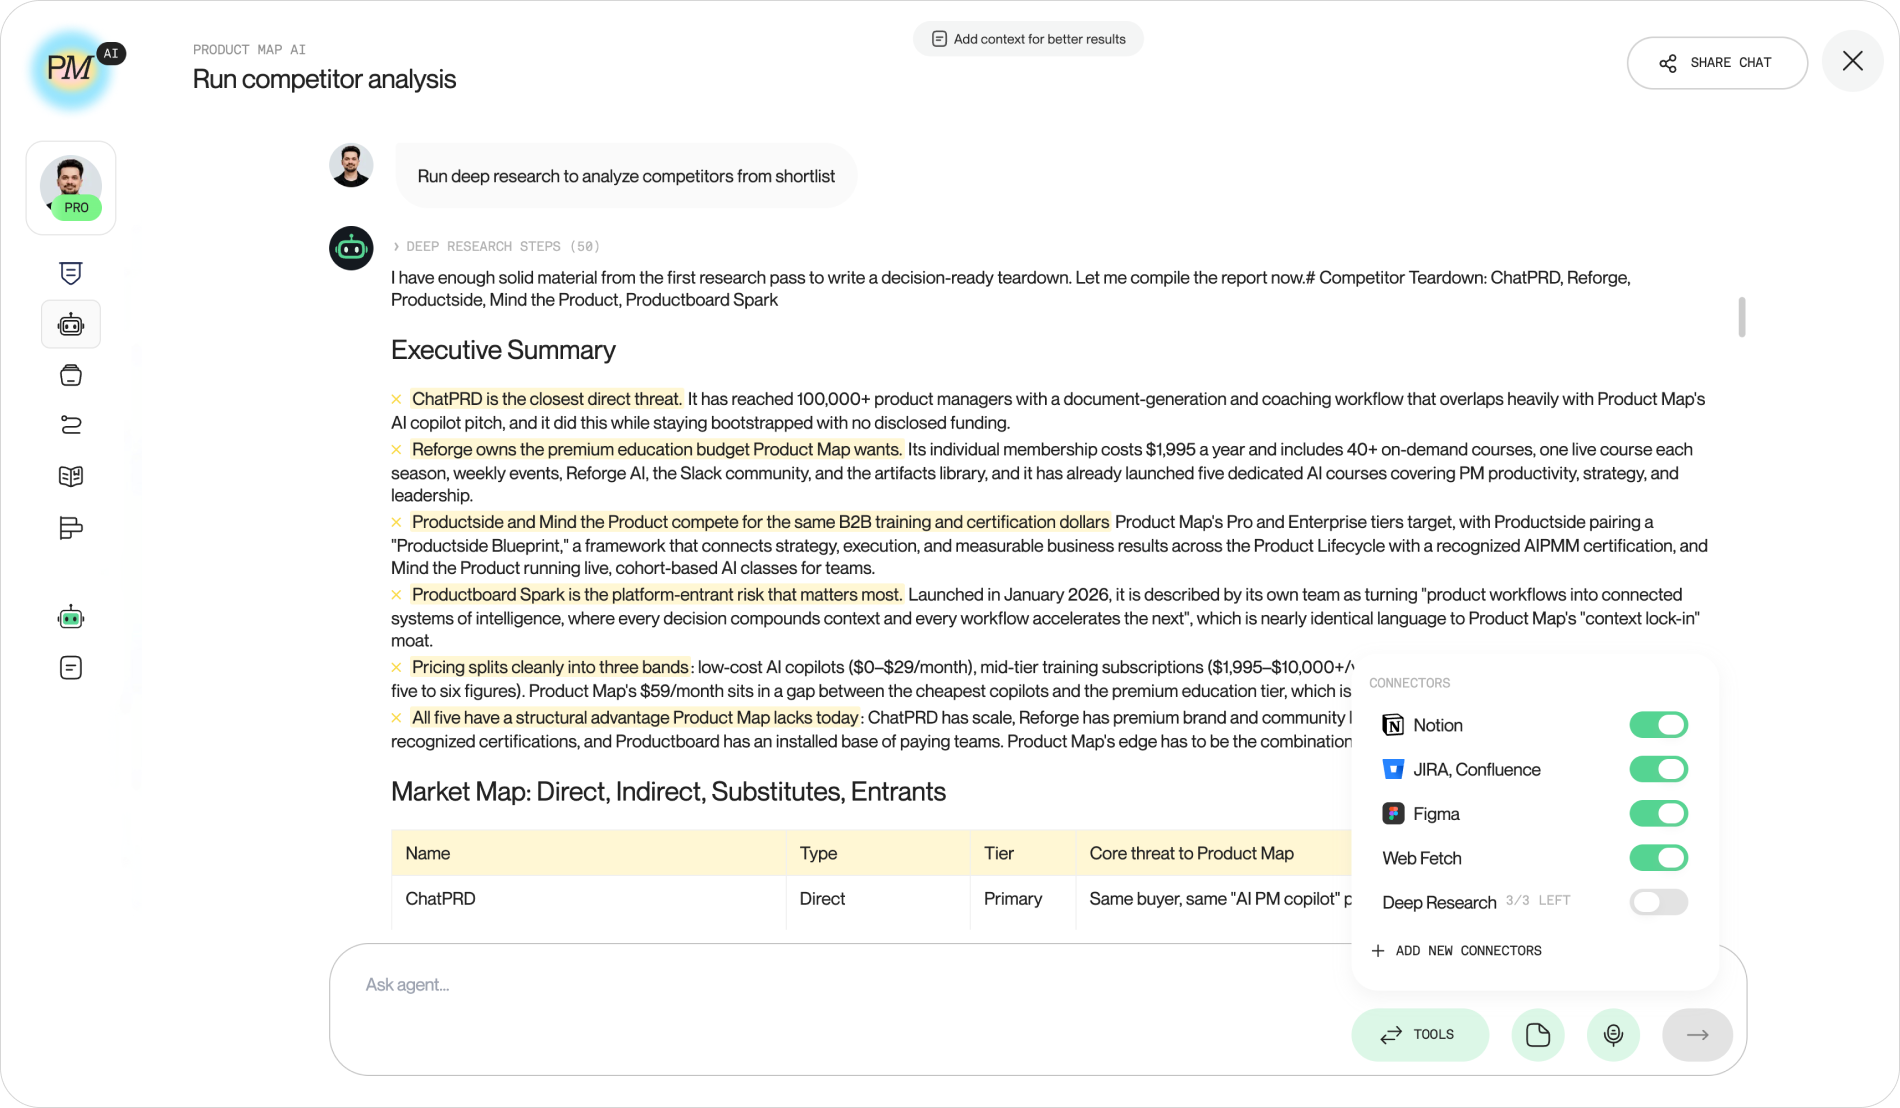
The startup product launch checklist is the founder guide for researching a market and calculating its size: secondary research, a bottom-up TAM, SAM, and SOM from customer counts and realistic revenue, competitor gaps, and the constraints that shrink the number. Investors will still nod at the slide. This time they'll open the assumptions too.
Two corrections every market model built in 2026 needs
Span Global's guide to recalculating TAM for 2026 names two errors 2023 models never faced. The first is overestimating AI readiness in the segment. A model will tell you AI expanded your addressable market, and in category terms it did. Buyers moved more slowly. Span Global's advice is to segment by adoption stage, with roughly 5 percent innovators, 15 percent early adopters, and 35 percent early majority, and to count only the stages your go-to-market can reach in the period you're sizing. An expanded category is not a ready customer.
The second is compression. AI commoditized products which commanded premium pricing three years ago. If your price anchor comes from a 2023 list, ask the model the compression question: what does an open-source or bundled alternative charge for the same job today? For Product Map the honest answer is that open-source PM operating systems on Claude Code now cover part of the topic graph for free, which caps the price on that layer.
Both corrections shrink the number. That's fine. An investor who has seen 40 decks this month is looking for the founder who cut their own market on purpose.
Write the caveats block: which assumptions break the model
The caveats block is where an AI-generated slide has nothing and a founder-owned model has its strongest evidence. It's a list of the assumptions which, if wrong, change the answer, with the direction and size of the error.
Write each caveat as a fact you don't have, not as a hedge. The Product Map pass carries eleven. The three with the most weight:
- Population gap: the 1 million active PMs and the 3 to 4 million McKinsey forecast differ fourfold. The model uses the low number for SAM, so SAM is a floor.
- Unverified peer revenue: Reforge's estimated revenue comes from a data vendor, and only its $81 million raise and the Miro acquisition are confirmed. Peer numbers set a ceiling, not a comp.
- No primary pricing research: willingness-to-pay is inferred from peer list prices, not from customer interviews. It's the first assumption to replace with data.
A caveat an investor finds before you do is a credibility problem. The same caveat, written by you with its impact stated, is proof you have a model, not a slide.
Then ask the model to attack the block. Which caveat, if it went the wrong way, moves SOM by more than half? The answer sets the order of your next three customer conversations.
Worked example: Product Map's own market sizing pass
Product Map sized its own market in May 2026 using the chain above. The figures below are rounded.
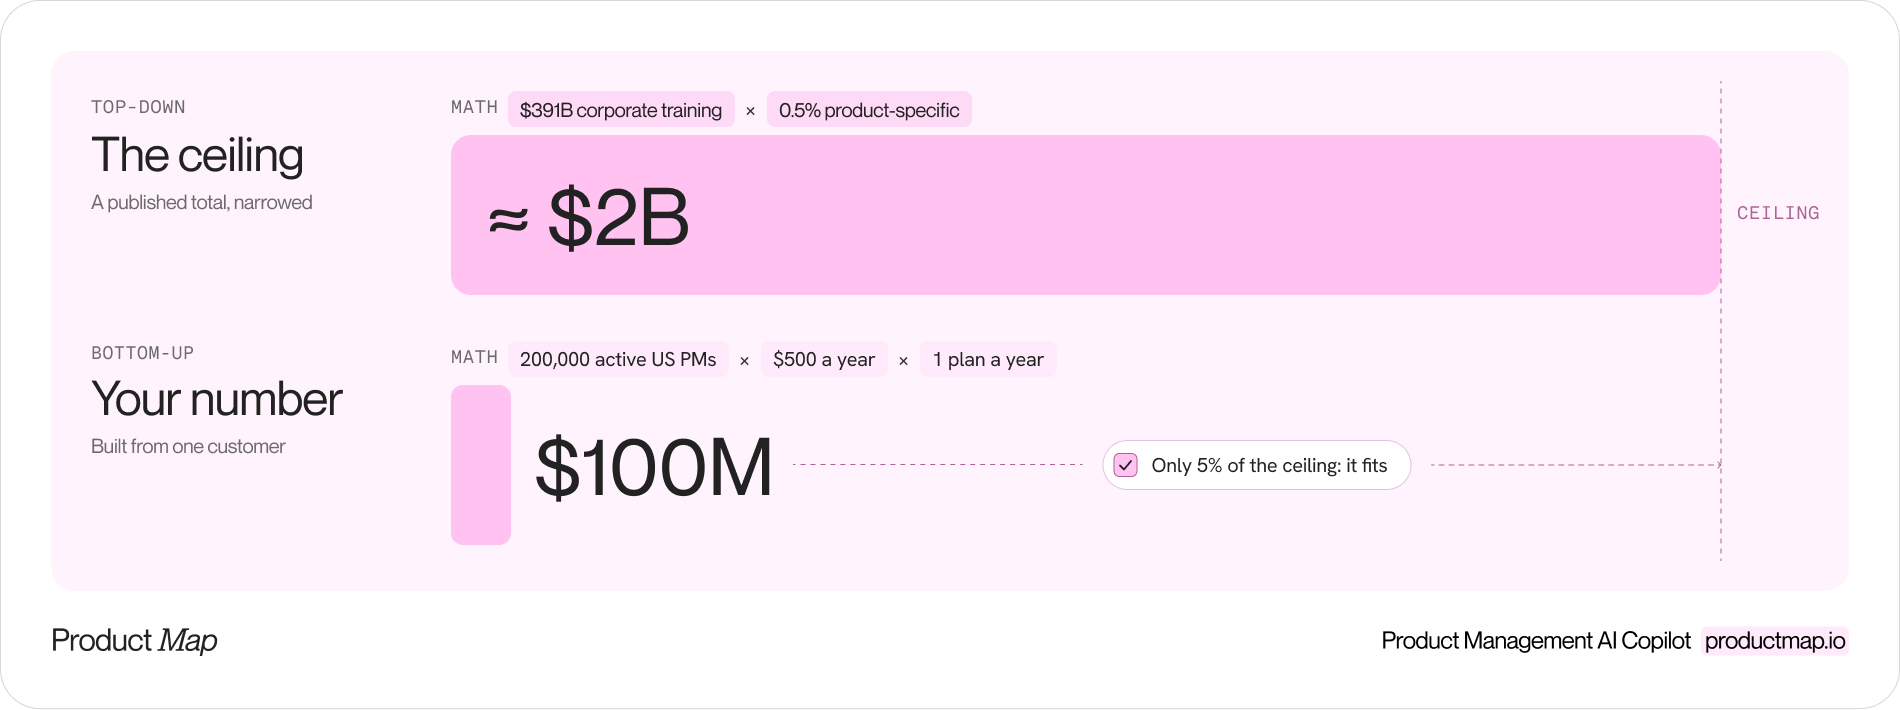
The top-down ceiling comes first. Corporate training is a $391 billion global market. If half a percent of it is product-specific spend, the ceiling is about $2 billion.
Next comes the bottom-up chain for PMs buying for themselves, by region. The United States has about 200,000 active PMs at a $500 blended annual price, or $100 million. The United Kingdom, Canada, and Australia add another $44 million at $400 a head. English-comfortable Europe, India, and the rest of the world add roughly $39 million at lower, purchasing-power-adjusted prices. Around 500,000 reachable PMs produce a serviceable market near $183 million.
Add the team chain from Step 4, about $250 million, and combined SAM lands near $580 million, inside the $2 billion ceiling and a fraction of the $4.3 billion base TAM.
Then the obtainable number, the one a term sheet is priced on. The three-year base case is about $1.3 million in annual recurring revenue: 1,200 Plus subscribers at $348 a year, 100 Pro seats at $1,188, and 30 team accounts at $25,000. Each line traces to a price already on the site and a count anchored to a peer's known trajectory. Bear and bull cases sit beside it with stated probabilities, and the caveats block follows.
That's the whole deck section: one ceiling, one chain, one obtainable figure, three scenarios, eleven caveats. The AI did the finding. The founder did the choosing. Both are visible on the page.
Put both numbers on one slide
Start the file before the next deck review. Ask for the ICP count with sources, and write the first caveat as soon as the sources disagree. Repeat for price and frequency. By the fourth input you'll have a bottom-up number you can defend, a ceiling beside it, and a list of the customer conversations to tighten both.