




A sales rep gets the launch email on a Tuesday. The deck, the one-pager, the FAQ, and the battlecard are all attached. By Thursday the rep has opened the battlecard, because a prospect asked about a competitor on a call. The rest sits in the thread. A month later the rep pitches the feature with a line they wrote themselves on the way to the meeting. Multiply one rep by a sales floor and you get the number product marketing keeps circulating.
Median reach of a sales-enablement asset is 22 percent within 30 days of publishing. Three of every four pieces of launch collateral never reach a rep's screen. And the pipeline lift a launch does produce fades from a median 38 percent in the launch quarter to 5 percent three quarters later.
Those numbers describe a launch run as a date with a checklist. The fix is to run go-to-market as a system: one source of truth product, marketing, and sales all read, a short list of tests to settle the frame before assets exist, and a 90-day loop to refresh what works and retire what nobody opened. This playbook covers all three.
The gap in 2026 launch data
Output is up. AI drafts launch copy for 73 percent of product marketers as of Q1 2026, up from 22 percent in 2024. Tier-1 launch cadence rose 30 percent since 2023. A growth-stage company now runs a median 2.4 tier-1 launches a year.
Reach did not follow. The 22 percent median comes from the same survey of 800-plus teams. More launches, more assets per launch, the same share of them read.
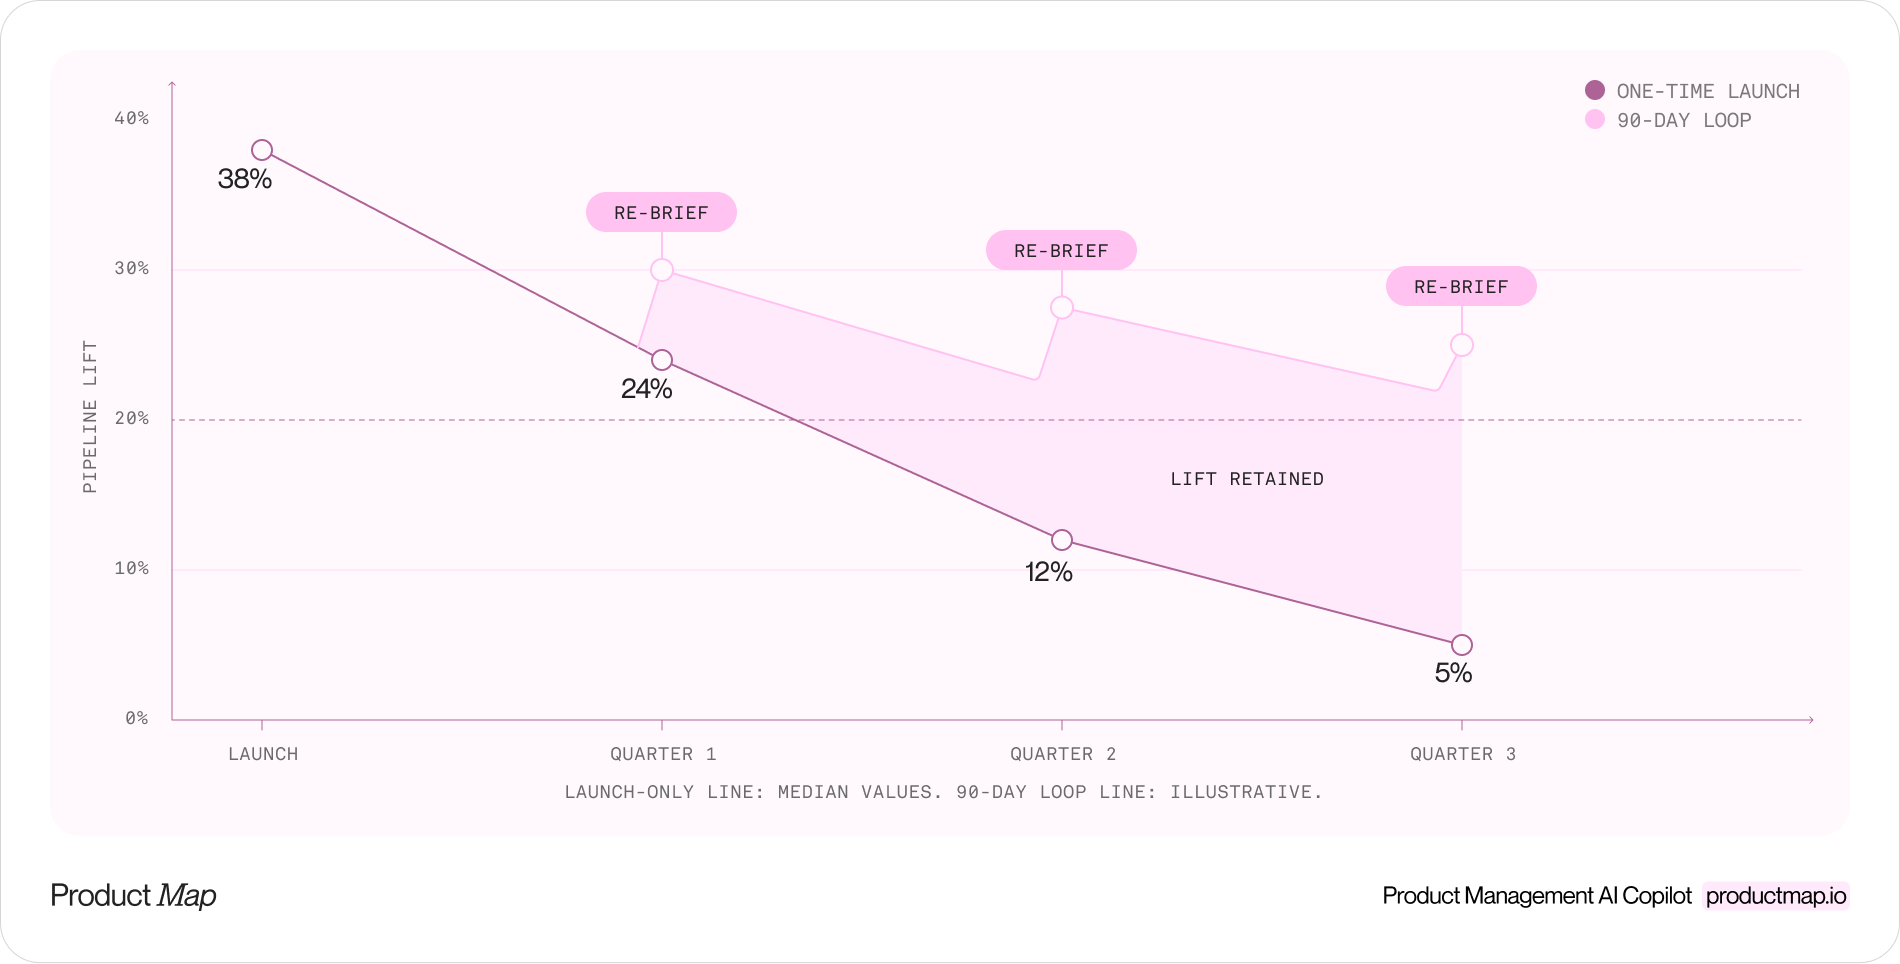
Lift decays on a schedule. Across 614 teams with attribution data, the median pipeline lift from a launch runs 38 percent in the launch quarter, 24 percent the next, 12 percent after that, and 5 percent by the third quarter out.
A launch buys a quarter of pipeline lift, a shelf of collateral, and a sales team pitching from memory by month four. That is what the 2026 numbers say a checklist launch delivers.
The bottleneck moved. It used to be producing the launch. Now it's keeping the launch alive in the people and tools doing the selling.

Why launch assets go unread
Look at reach by asset type and the pattern has nothing to do with writing quality:
- Battlecards: 67 percent reach within 30 days
- Internal training: 52 percent
- Customer stories: 41 percent
- Launch decks: 28 percent
- Win-loss summaries: 24 percent
- Sales sheets and one-pagers: 18 percent
A battlecard and a one-pager get written by the same person, in the same week, about the same feature. One gets read almost four times as often. The difference is where each one lives. A battlecard answers a question the rep is being asked right now, on a live deal, and it sits inside the CRM or the deal room. A one-pager describes the feature in general and sits in a shared drive nobody opens during a call.
So the asset-to-rep gap is a distribution problem. An asset gets read when it is short, tied to a moment in the sales conversation, and stored where the moment happens. An asset gets skipped when it is a file in a folder, announced once by email.
That changes the launch deliverable. The deliverable is not the set of files. It is the answer a rep, a support agent, or an AI assistant gives when a customer asks about the feature, plus the system keeping the answer current.
The GTM source of truth every team and agent reads
Luke Farrugia, answering Alina Vandenberghe's survey of more than a hundred marketing leaders on product marketing in 2026, put the shift in one sentence. The differentiator is no longer who writes better messaging or runs tighter launches. It is who can design and run the GTM system keeping product, marketing, and sales aligned around one source of truth.
The source of truth is a file, not a meeting. In the Product Map knowledge structure it lives at 02_generation/marketing/gtm-strategy.md, next to messaging-framework.md and launch-checklist.md, inside the same Git repository as the rest of the product context. If you already keep a product context repository, this is one more folder in it. If you don't, a shared Markdown file works on day one.
Six blocks belong in it:
- Segment: the ideal customer profile and the beachhead for this launch, with disqualifiers. Link the ICP file instead of pasting it.
- Positioning: competitive alternatives from the buyer's point of view, two to four value pillars, and the category frame you chose and why.
- Proof points: the numbers, customer quotes, and third-party evidence behind each pillar, each with a source someone can open.
- Pricing and packaging: the price metric, the plan the feature lands in, and what changes for existing customers. The monetization and pricing topic covers how to pick the metric. The GTM file records the decision.
- Objections: the eight to ten questions buyers raise, with the agreed answer. This block is the battlecard's parent.
- Launch tier and metrics: T1, T2, or T3, the owners, and the two numbers the retro will grade.
Every asset derives from the file. The battlecard is the objections block compressed. The landing page is positioning plus proof. The rep's talk track is the segment and the pillars. When a number changes, it changes in one place, and the derivatives get regenerated.
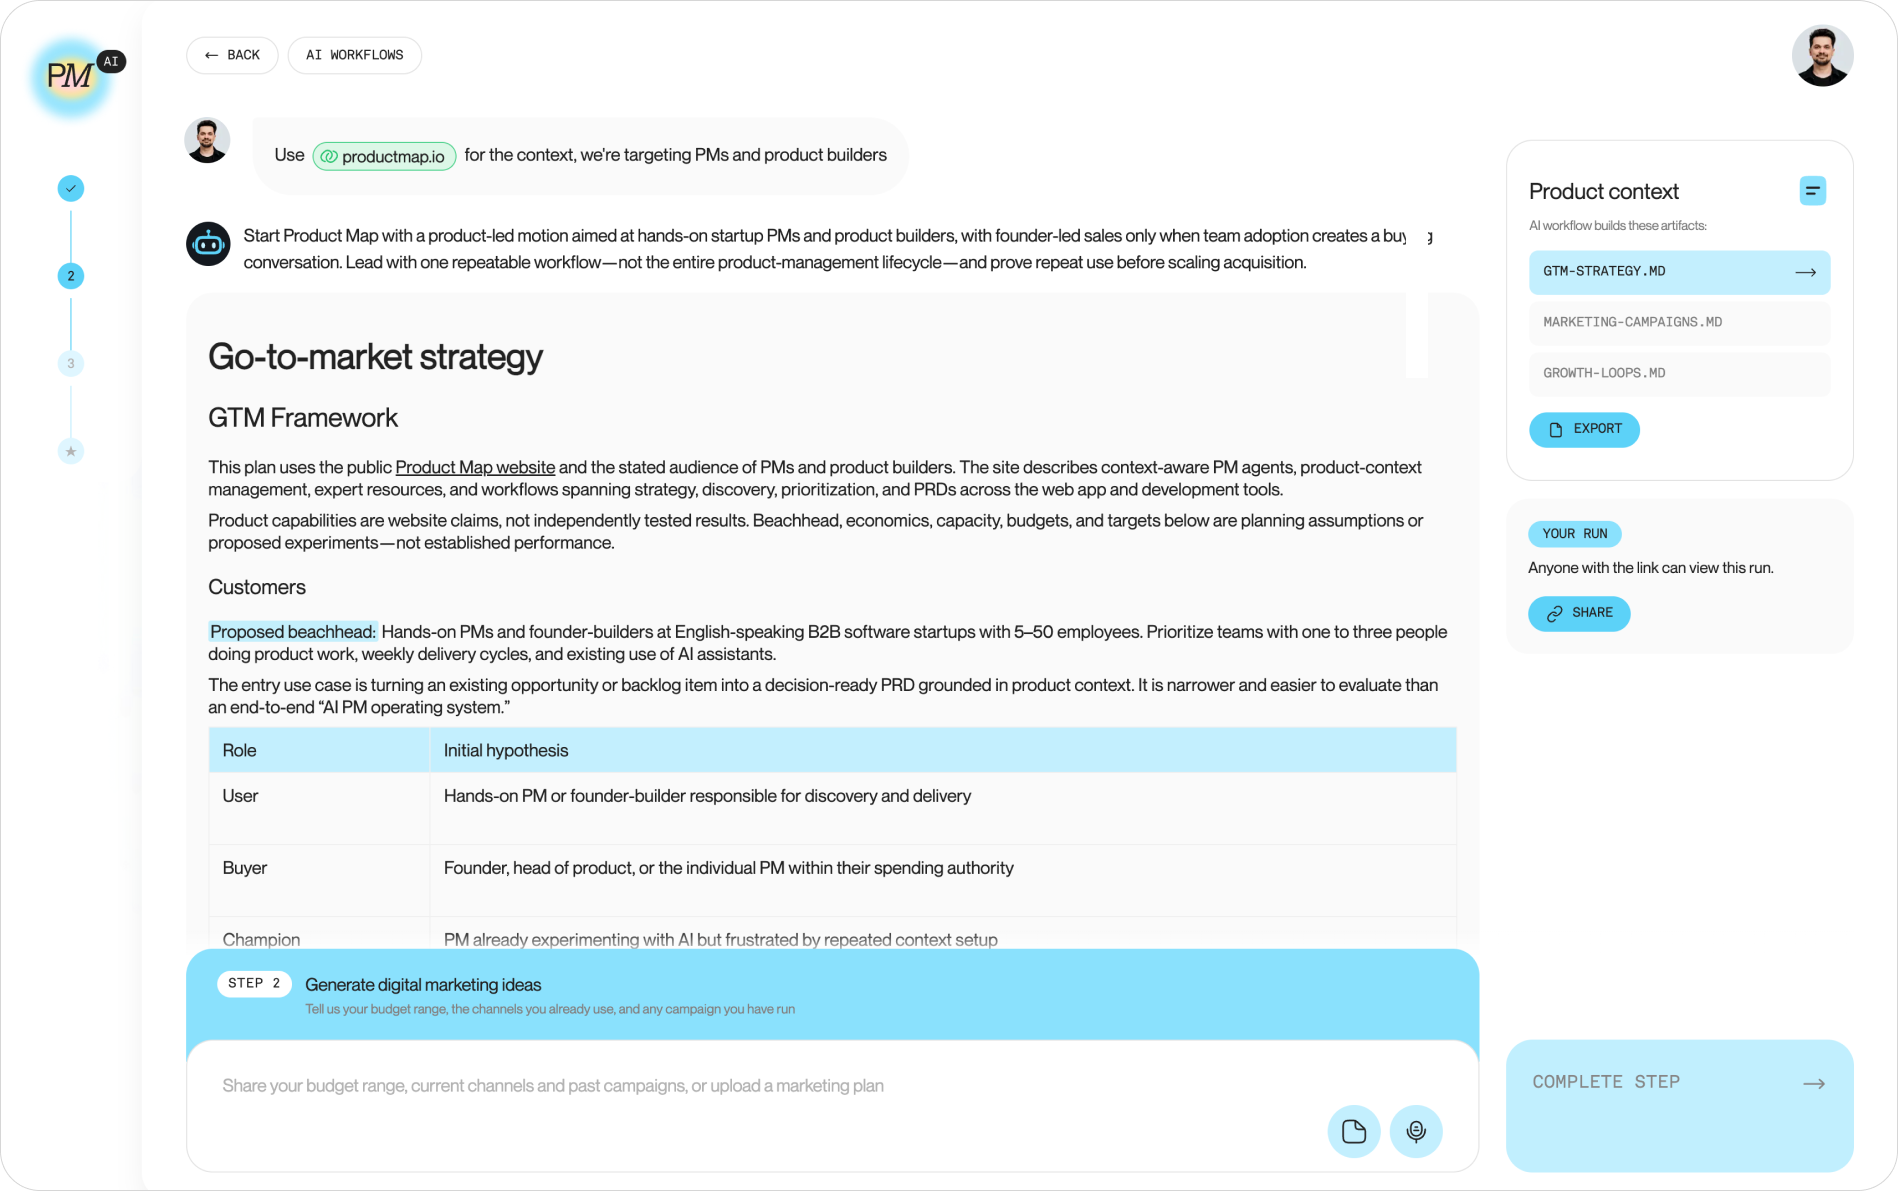
The file also changes what an AI agent can do. A model asked to "write a battlecard" from a blank prompt produces a plausible one. A model reading the objections block, the pricing decision, and the proof points produces yours.
Test the category frame before you test the headline
Positioning tests have a clear hierarchy, and many teams run them in the wrong order. Across 287 teams running four or more positioning tests a year, the win rate by test type looks like this:
- Category framing: wins 54 percent of tests, with an average lift of 19 points
- Value proposition: 41 percent, 11-point lift
- Target customer: 38 percent, 8-point lift
- Hero copy: 31 percent, 5-point lift
The frame decides more than the headline, and it decides earlier. Category framing is the fifth step in April Dunford's positioning sequence, and it is the one every derived asset inherits. Change the frame after launch and every battlecard, page, and talk track is out of date at once. Change the headline and you touched one page.
So the testing budget goes to the top of the list. Before assets exist, run two or three category frames past the segment: a landing page variant, a cold outbound sequence, or ten customer conversations with the frame stated up front. Write the winner into the positioning block. Hero copy tests come last, after the frame is locked.
The teams in the sample ran at least four tests in twelve months. A team running its first test has no baseline, so the first quarter's job is to establish one, not to win.
The 90-day loop
Elena Verna's read on AI products, from her December 2025 conversation with Lenny Rachitsky, is that product-market fit now has to be re-found every three months and that 60 to 70 percent of traditional growth tactics no longer apply. Whether or not your product ships a model, the launch-lift decay curve says the same. By the third quarter out, the lift is gone.
So GTM becomes a quarterly loop with four steps instead of a date:
- Re-check fit. Pull last quarter's win-loss notes, activation numbers for the launch segment, and support tickets mentioning the feature. Does the segment in the file still match who bought and stayed?
- Refresh the file. Update proof points with new customer numbers. Add the objections sales heard in the last 90 days and retire the ones nobody raised. Re-run the category frame if the fit check moved.
- Retire unopened assets. Pull open and download stats on every asset from the last launch. Anything under the 22 percent median gets archived or merged into the asset people did read. Fewer files, each one closer to the moment it gets used.
- Re-brief. Regenerate the derived assets from the updated file, then run a 20-minute enablement session with sales and support on what changed. This is the re-launch, and it is what keeps lift from sliding to 5 percent.
Sales objections, lost deals, onboarding confusion, and support tickets are market feedback. The quarterly refresh is how the GTM system learns.
What the PM owns and what an AI agent drafts instead
Split the work along the line between decisions and derivatives.
The PM owns the decisions in the file: the segment and its disqualifiers, the category frame, the price metric, the launch tier, and which assets get retired. Each one is a tradeoff a model can inform and cannot make, because each one commits the company to a bet.
An agent drafts the derivatives from the file: channel variants of the pillars, the FAQ, the battlecard refresh after each win-loss batch, the enablement notes for the re-brief, and the first pass of any test variant. Every draft cites the block it came from, so a reviewer checks the file, not the prose.
Product Map's agents read the same 02_generation/marketing/ folder as the rest of your product context, so the draft they return for a battlecard or an FAQ starts from your positioning block and your pricing decision, not from a generic prompt.
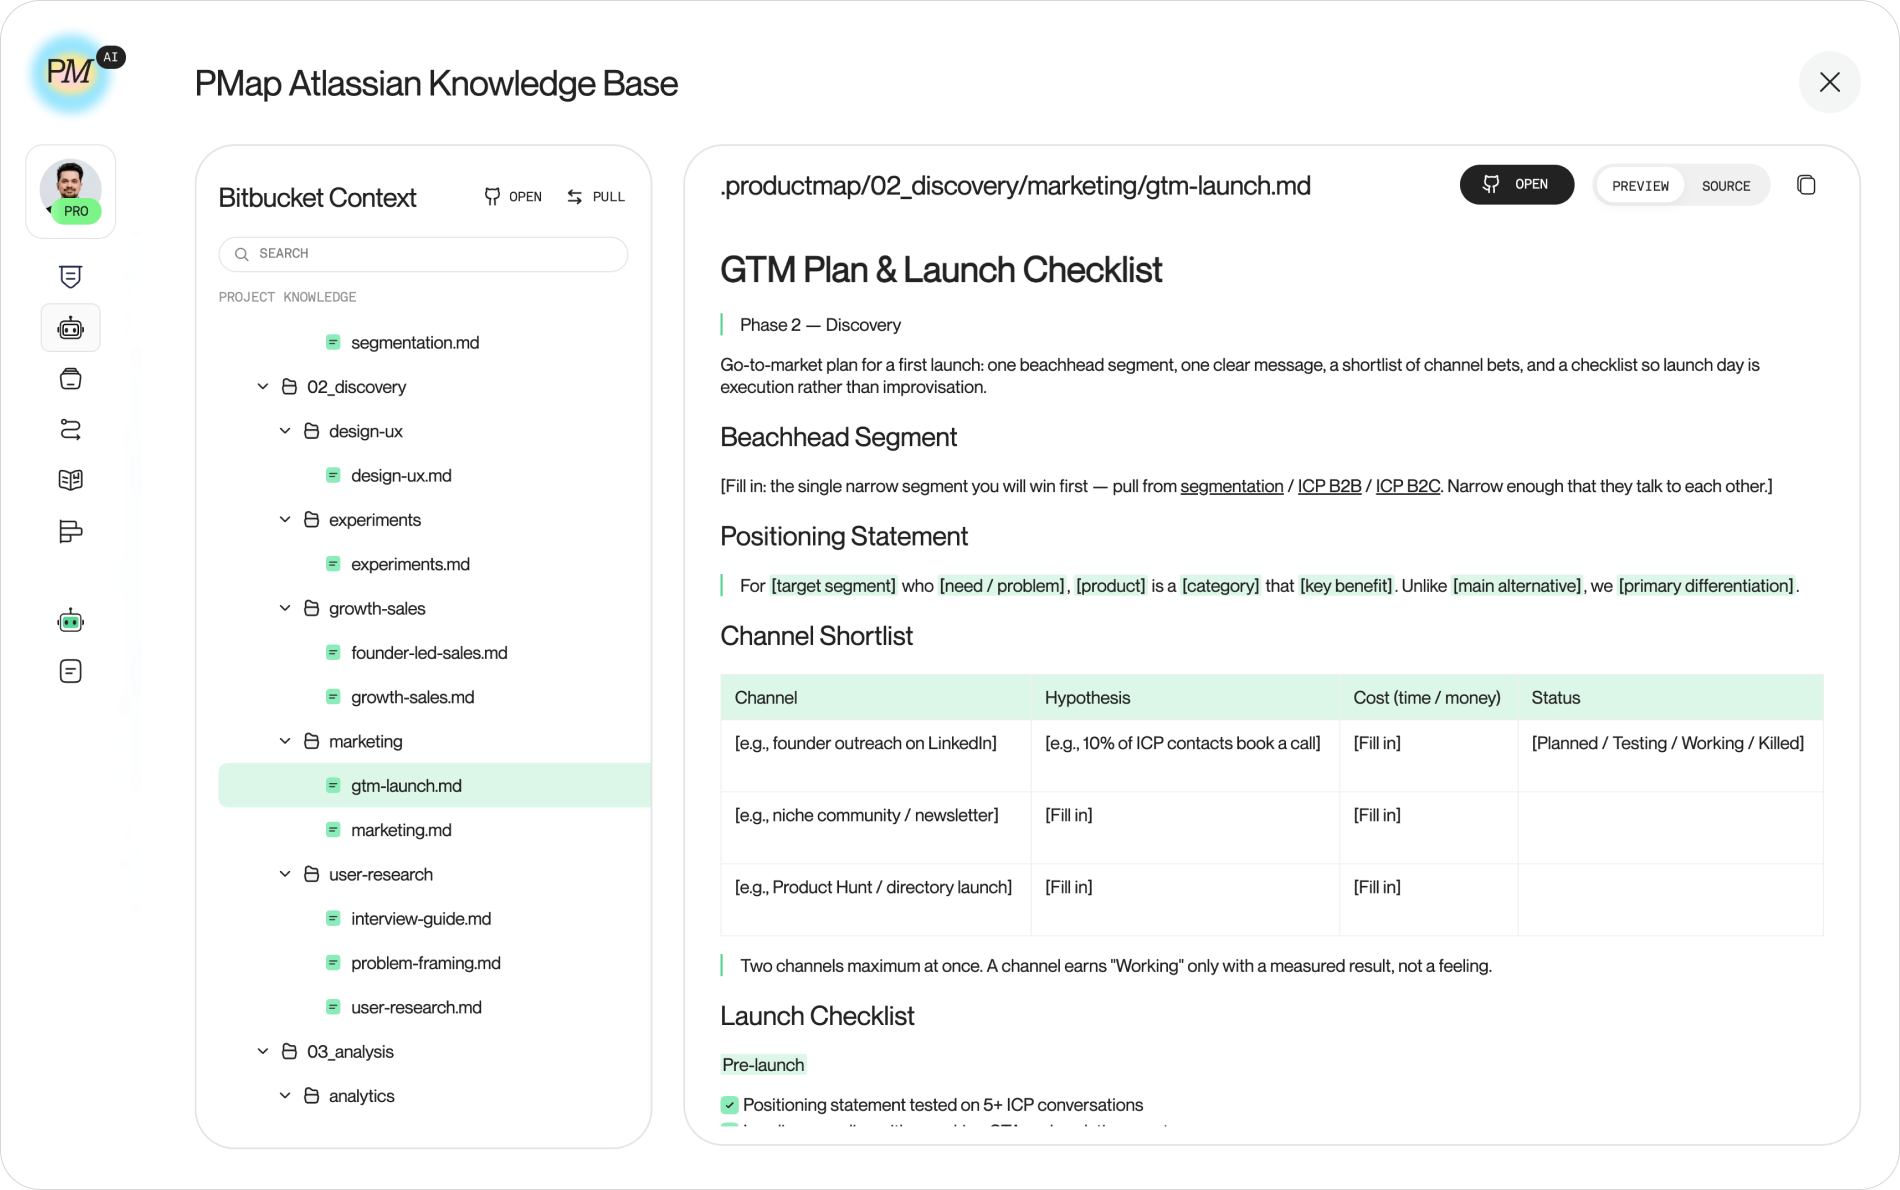
The startup product launch checklist becomes the runbook for each pass through the loop. Six weeks out the file is approved. Two weeks out the derivatives are reviewed. One week out the team is briefed. After launch, the reach and lift numbers land on the retro.
Put reach on the retro slide
One number never makes the launch retro: how many of the assets got read. Retros grade the launch quarter, output volume, and the day-one metrics. Nobody puts the 30-day reach figure or the Q+2 lift on the slide, so the decay stays invisible until the next planning cycle asks why the feature stopped showing up in pipeline.
Two numbers fix it. Assets opened by a rep within 30 days, by asset type. And pipeline lift attributed to the launch two quarters out. One grades the system, the other grades the loop.
Add a third if you run more than two tier-1 launches a year. Count how many of them deserved the tier. A T1 launch for a T3 change spends the attention budget the next real T1 needs, and the same survey behind the reach numbers found top-quartile teams running four T1 launches a year. If three of yours go unread, the fix is fewer launches, run as a system.