

Take an AI feature priced at $40 a seat. The median account runs 180 tasks a month at six cents each, so inference costs $10.80 and the margin looks healthy at 73 percent. Now let the heaviest tenth of accounts run 1,400 tasks a month at ten cents each. Those accounts cost $140 against $40 of revenue. The blended margin on the dashboard still reads 58 percent, and the pricing slide from last planning cycle still says $40 a seat. Nothing in that slide knows the model price dropped in March, or that a prompt change in June doubled tokens per task.
Pricing for AI products is a set of numbers tied to costs you don't control, and the numbers move monthly. A slide can't move with them. A file can, if an agent reads it, recomputes it, and tells you when a number crossed a line.
This article is the pricing entry in the same template series as Product Map's AI PRD, strategy, and unit economics files. It covers where pricing moved in 2026, the five numbers the file has to carry, the acceptance-rate math behind outcome pricing, the full markdown template, the triggers an agent watches, and one feature priced before and after.
Hybrid pricing is now the default, and seats are gone
OpenMeter and Growth Unhinged surveyed 230 software companies in September 2026. Hybrid pricing, a base subscription plus metered usage or credits, sits at 37 percent of respondents and 47 percent say they're heading there. Outcome-based pricing is at 5 percent now, with 31 percent planning it. Flat-rate plus per-seat pricing drops from 42 percent to 8 percent among the same companies. The median gross-margin target for AI products in the survey is about 50 percent, down from the 70 to 80 percent SaaS used to assume.
Credits followed the same path: 29 percent of companies bill in AI credits already and 33 percent plan to. GitHub Copilot moved every plan to usage-based billing on June 1, 2026, which settled the argument for a lot of buyers who'd resisted meters.
Seats and flat rates didn't lose because buyers hated them. They lost because an agent doing the work erases the seat it was meant to fill, and because inference cost scales with use while a flat price doesn't. The per-seat pricing piece covers the model choice and the migration. This one assumes you've landed on hybrid or outcome pricing and need the file underneath it.
A pricing model you can't recompute when the model price changes is a pricing model you'll discover is wrong from the margin report.
The Monetization & Pricing guide puts the rule plainly: good pricing places friction after value is proven, and a value metric has to scale with customer success, be measurable by you, be understandable to the buyer, and stay forecastable in procurement. Hybrid passes those tests more often than its alternatives, which is why it won. But hybrid has more moving parts than a seat price, and every part has a cost number behind it.
The five numbers every AI pricing file has to carry
Most pricing docs record the price. The file has to record what the price was derived from, so the derivation can run again. Five numbers do most of the work.
- Cost per task at P50 and P90. Tokens per task times price per token, plus retrieval and tool calls, at the median and the 90th percentile. One number hides the tail. The HarnessTax study Tomasz Tunguz covered in September 2026 ran the same model through different harnesses and got $1.54 per resolved task on one and $0.44 on another, so this number belongs to your setup, not the model's price list.
- Margin floor. The gross margin below which the price is wrong, stated as a percentage and applied at the P50 account. Causo's 2026 pricing guide suggests setting the base price for a 60 percent margin on the P50 user. The survey's median target is 50 percent. Pick yours and write it down, because every other number is checked against it.
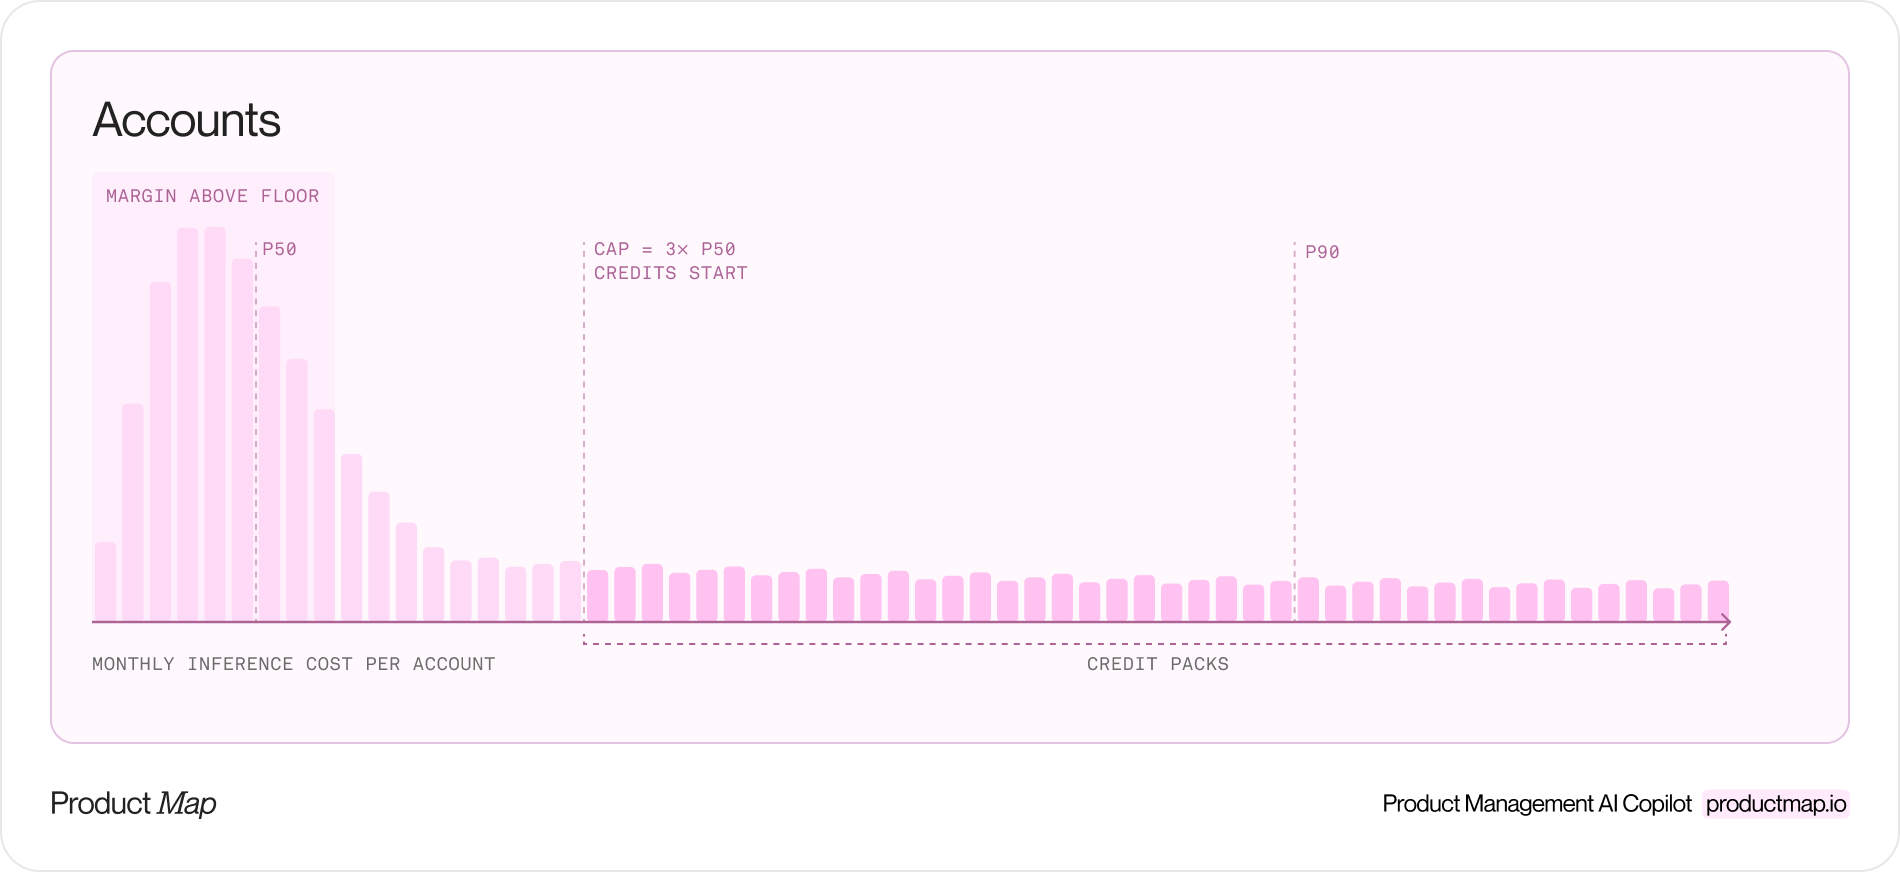
- Cap as a multiple of P50. The usage included in the base price before credits kick in, expressed as a multiple of median usage. Causo's guidance is about 3x P50. The multiple matters more than the absolute number, because when P50 moves the cap moves with it.
- Credit pack sizes. The units a customer buys past the cap, their price, and the implied price per task. Each pack is checked against the same floor using P50 cost, and the file records the per-task cost the pack assumes.
- Overage rule. What happens at the cap: a hard stop, a prompt to buy a pack, or automatic top-up with a ceiling the customer sets. The guide's heavy-user margin collapse symptom is what happens when this line is missing.
Two more lines turn these five into something an agent can re-run: the provider price per token the costs were computed at, and the date. Without those, a cost drift and a price cut look identical.
Outcome pricing lives or dies on the acceptance rate
Outcome-based pricing charges for the result: a resolved ticket, an accepted draft, a qualified lead. The buyer loves it because they pay for work done. The margin problem is the attempts the buyer never pays for.
If the agent gets one outcome accepted for every two and a half attempts, the cost of an accepted outcome is two and a half times the cost of an attempt. Lago's 2026 pricing guide works a 40 percent acceptance example: at 50 cents per attempt, an accepted outcome costs $1.25 before margin, and a 50 percent floor puts the minimum price at $2.50 per outcome. Price it at $1.50 because a competitor did and you lose money on every success.
The file needs three lines for this model:
- Price per accepted outcome, and the definition of accepted, agreed with the customer before launch. A reopened ticket, an edited draft, and a lead sales rejects all need a rule.
- Attempts per accepted outcome, measured, at P50 and P90 per segment.
- The acceptance-rate threshold: the rate below which the outcome price falls under the margin floor. Divide cost per attempt by the price times one minus the floor. At $0.50 per attempt, a $2.50 price, and a 50 percent floor, the threshold is 40 percent. Drop to 35 percent acceptance and the margin is gone.
That threshold is the first trigger an agent watches, because acceptance moves with model quality, prompt changes, and the customer's own data. It's the number outcome-pricing decks never show and the number finance asks for first.
Blended margins hide the account that loses you money
The 58 percent blended margin in the opening example is true and useless. Inside it, 92 percent of accounts run at 70 percent or better and 8 percent run negative. Average the two and nothing looks broken. The margin trap article covers why the distribution does this; the pricing file is where you stop it.
Per-customer attribution means every account carries its own inference cost for the month, computed from its tasks and its per-task cost, and its own margin against what it paid. The file doesn't hold the ledger. It holds the rule: which export the numbers come from, which accounts count as below floor, and how many consecutive months below the floor triggers a review.
Two facts come out of this, and the blended number shows neither. The first is that heavy accounts often have a higher per-task cost, not only more tasks. They ask longer questions over bigger data, hit retries more, and run the expensive paths. A credit pack priced on P50 cost undercharges them even after they've paid for the pack. The second is revenue share. Ten accounts below floor that make up 0.4 percent of revenue are a logging line. Ten accounts below floor that make up 18 percent of revenue are a repricing.
The unit economics improvements topic treats the same problem from the COGS side. The pricing file and the unit economics model share the P50 and P90 lines, so keep the two in the same repository and let the pricing file read its cost inputs from the model instead of copying them.
Copy-paste pricing template
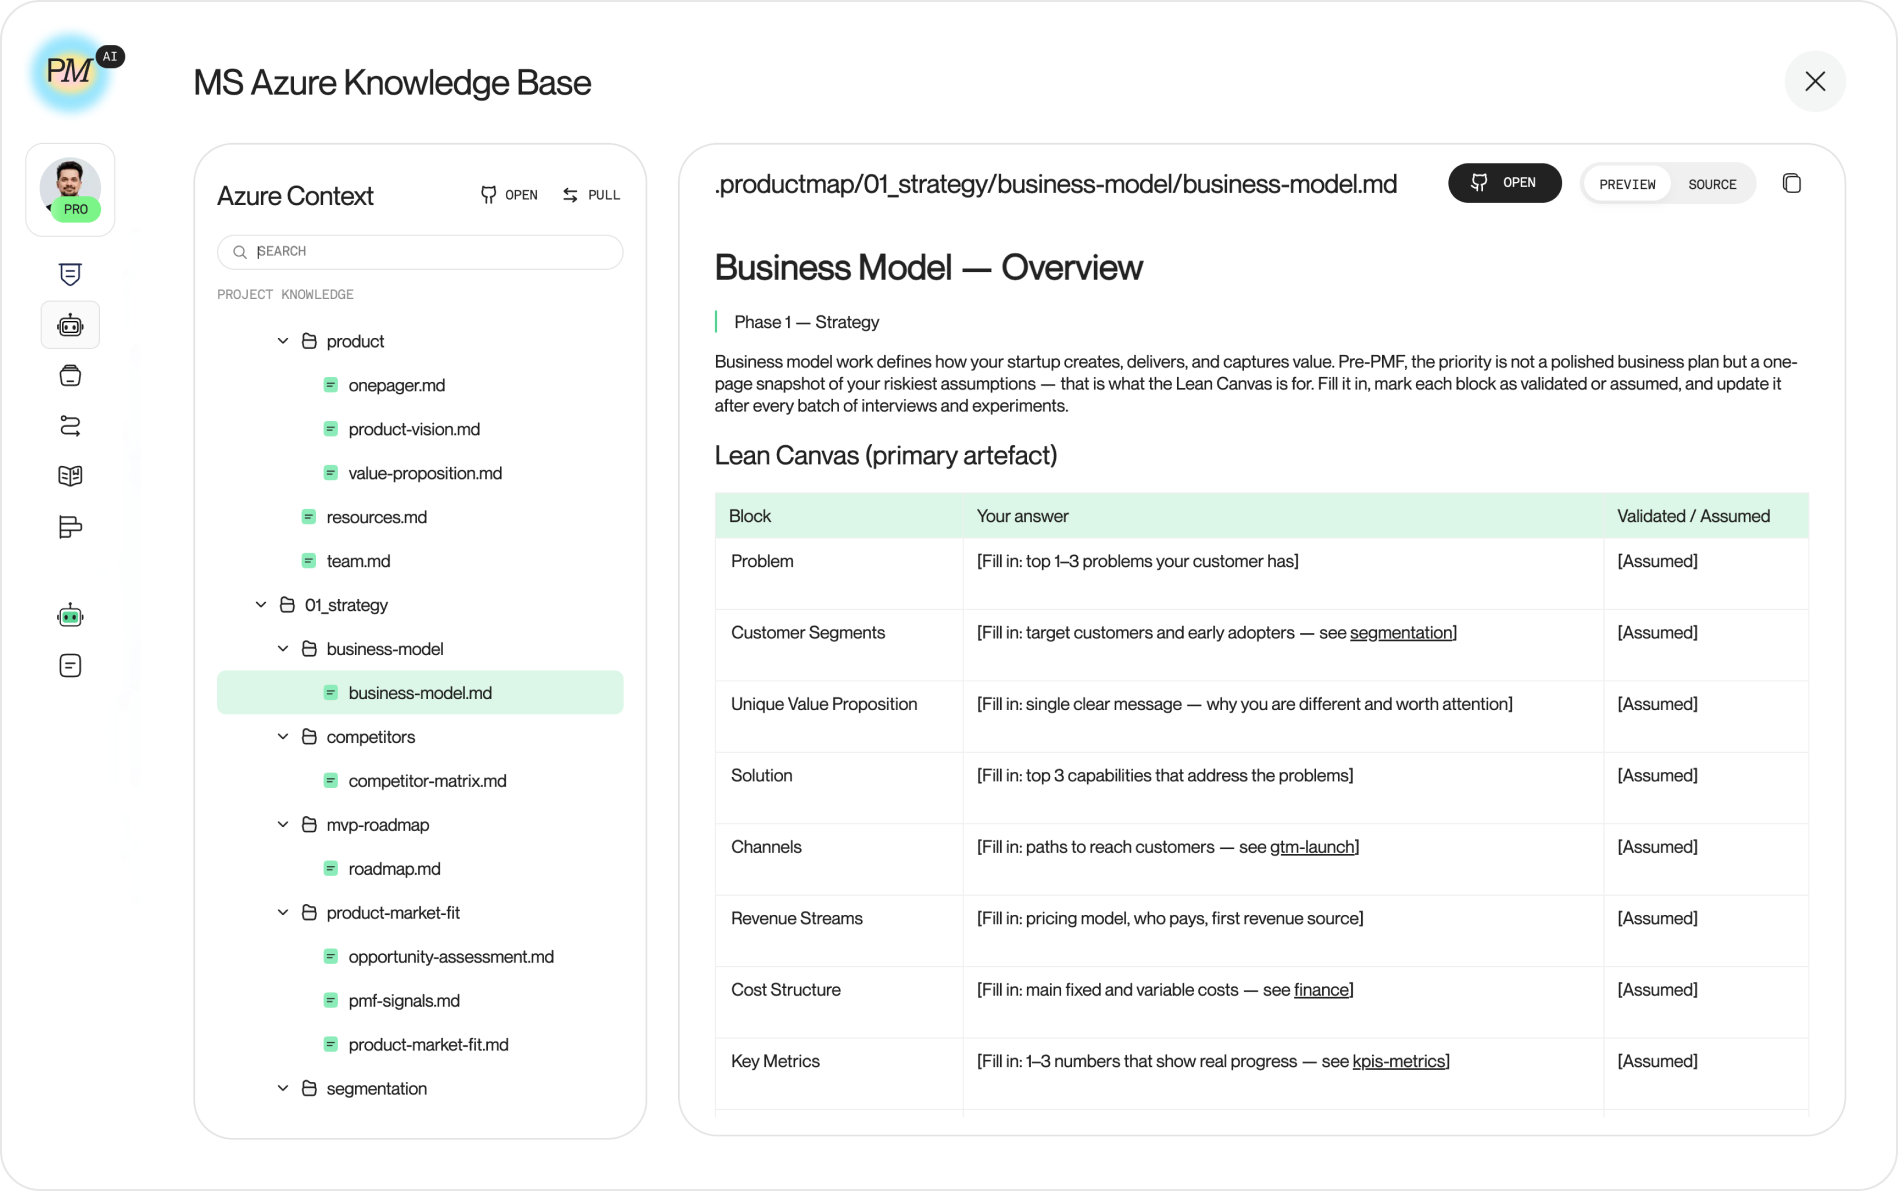
The template below follows the format of the context files Product Map generates into a project repository, so an agent working in that repository reads it the way it reads the strategy, PRD, and unit economics files. Save it as pricing-model.md under 01_strategy/business-model/, next to the business model canvas. Keep the headings verbatim. Mark every input as measured, assumed, or benchmark, and delete the outcome section for products priced on usage alone.
# Pricing Model: [Product / Feature / Segment]

> Phase 1, Strategy | Status: [draft / reviewed / live] | Owner: [name] | Updated: [YYYY-MM-DD]
> Provider prices as of: [YYYY-MM-DD] | Recompute cadence: [monthly / on trigger]

## Definitions

[Freeze these before entering a number. Every formula below uses them.]

- Task: [one unit of AI work the customer recognizes, e.g. one answered question, one drafted spec]
- Account: [the unit of attribution: workspace / tenant / seat]
- Margin basis: [gross, inference and hosting only / contribution, including support and payment fees]
- Accepted outcome (outcome pricing only): [definition agreed with customers; reopen and edit rules]
- Segments this file covers: [e.g. SMB self-serve, mid-market sales-led]
- Data sources: [inference logs, billing export, usage warehouse], linked under 10_data/

## Cost Inputs

[Basis for each value: measured, assumed, or benchmark. Never leave basis blank.]

- Price per 1M input tokens: $[ ] (provider, model, date) | basis: [ ]
- Price per 1M output tokens: $[ ] | basis: [ ]
- Tokens per task: P50 [ ] / P90 [ ] | basis: [ ]
- Retrieval and tool-call cost per task: $[ ] | basis: [ ]
- Cost per task: P50 $[ ] / P90 $[ ]  (tokens x price + tools)
- Tasks per account per month: P50 [ ] / P90 [ ] | basis: [ ]
- Inference cost per account per month: P50 $[ ] / P90 $[ ]
- Heavy-user per-task cost (top 10% of accounts by usage): $[ ] | basis: [ ]
- Attempts per accepted outcome (outcome pricing only): P50 [ ] / P90 [ ]

## Margin Floor

- Floor: [ ]% [gross / contribution], applied at the P50 account
- Max allowed cost at the base price: base price x (1 - floor) = $[ ]
- Headroom: tasks at P50 cost before the base plan hits the floor = [ ]
- Cost drift the base plan absorbs before breaching: [ ]%

## Plans and Caps

[One line per plan. The cap is a multiple of P50 usage, so it moves when P50 moves.]

- [Plan name]: $[ ] per [seat / account / month]
  - Included tasks: [ ]  ([ ]x P50)
  - Cost of included tasks at P50: $[ ]  ->  margin on included: [ ]%
  - Cap before credits: [ ] tasks  ([ ]x P50)
  - Who it's for and the next plan up: [ ]
- [Plan name]: ...

## Credits and Overage

- Credit pack: [ ] tasks for $[ ]  ->  $[ ] per task, [ ]x P50 cost, margin [ ]%
- Second pack size for heavy accounts: [ ] tasks for $[ ]  ->  margin [ ]%
- Overage rule at the cap: [hard stop / prompt to buy / auto top-up with customer-set ceiling]
- Credit expiry: [none / rolling 12 months]; breakage policy: [ ]
- Billing timing: [in advance for base, in arrears for credits]; invoice controls: [alerts at 50 / 80 / 100%]

## Outcome Pricing (delete if not used)

- Price per accepted outcome: $[ ]
- Cost per accepted outcome at P50 attempts: $[ ]  ->  margin [ ]%
- Acceptance-rate threshold: cost per attempt / (price x (1 - floor)) = [ ]%
- Current acceptance rate: [ ]% per segment  |  gap to threshold: [ ] points
- Fallback when acceptance falls below threshold: [reprice / route to cheaper model / cap attempts]

## Per-Customer Attribution

- Source: [inference log joined to billing on account id], refreshed [weekly / monthly]
- Below-floor account: margin under [ ]% for [ ] consecutive months
- Accounts below floor now: [ ] accounts, [ ]% of revenue
- Heavy-user per-task cost vs P50: [ ]x  (above 1.5x means packs are underpriced for them)
- Review owner: [name]

## Repricing Triggers

[What the agent recomputes on its own, what it proposes, and what it asks about.]

- Provider price change of [ ]% or more: recompute all margins -> propose pass-through or hold
- P50 cost per task drift above [ ]% in 30 days: recompute -> propose cap and pack changes
- More than [ ]% of accounts hit the cap in a month: flag -> packaging review
- Below-floor accounts above [ ]% of revenue: flag -> ask for repricing decision
- Acceptance rate within [ ] points of threshold: flag -> ask
- Approval tiers: recompute = log only; proposal = pull request; customer-facing price change = human decision

## Decision Log

- [YYYY-MM-DD] [decision, numbers before and after, who decided, which trigger fired]

## Open Questions

- [question] | owner: [ ] | due: [YYYY-MM-DD]
The file is prose-shaped on purpose, not a spreadsheet. A spreadsheet holds the arithmetic and loses the reasoning; the decision log and the trigger thresholds are what the next PM, and the next agent session, need to see next to the numbers.
The repricing triggers an agent recomputes for you
The template's last working section is the one no pricing deck has. Each trigger names a condition, a threshold, and what happens when it fires. The point is to separate three kinds of agent action, because treating them all the same produces either a flood of approval prompts nobody reads or a price change nobody approved.
Recompute runs without asking. When the provider publishes a new price, the agent reads the cost inputs, recomputes every margin line, updates the file, and writes a dated entry in the decision log. No human needed, because no customer-facing number changed. Propose opens a change for review. When P50 cost drifts past the threshold, the agent drafts new cap and pack numbers that restore the floor and submits them as a pull request with the before-and-after math. Ask stops for a decision. Anything a customer would see on an invoice waits for a person.
Five triggers cover most AI products:
- Provider price change. The most common one in 2026 and the one most teams handle by accident. A 40 percent price cut is a margin windfall or a competitive problem depending on what rivals do with theirs, which is a decision, not a recompute.
- P50 cost drift. Prompt changes, longer contexts, a new retrieval step, or a model swap move the median cost without anyone touching pricing. A 20 percent drift in 30 days is a reasonable threshold.
- Cap breaches. If more than a tenth of accounts hit the cap in a month, the cap is wrong, not the customers. The fix is packaging.
- Below-floor revenue share. Accounts under the floor for three months, weighted by revenue. The weighting is what turns a list into a decision.
- Acceptance rate. For outcome pricing, the distance to the threshold computed above. Watch it per segment, because one customer's messy data can sink the rate for their account alone.
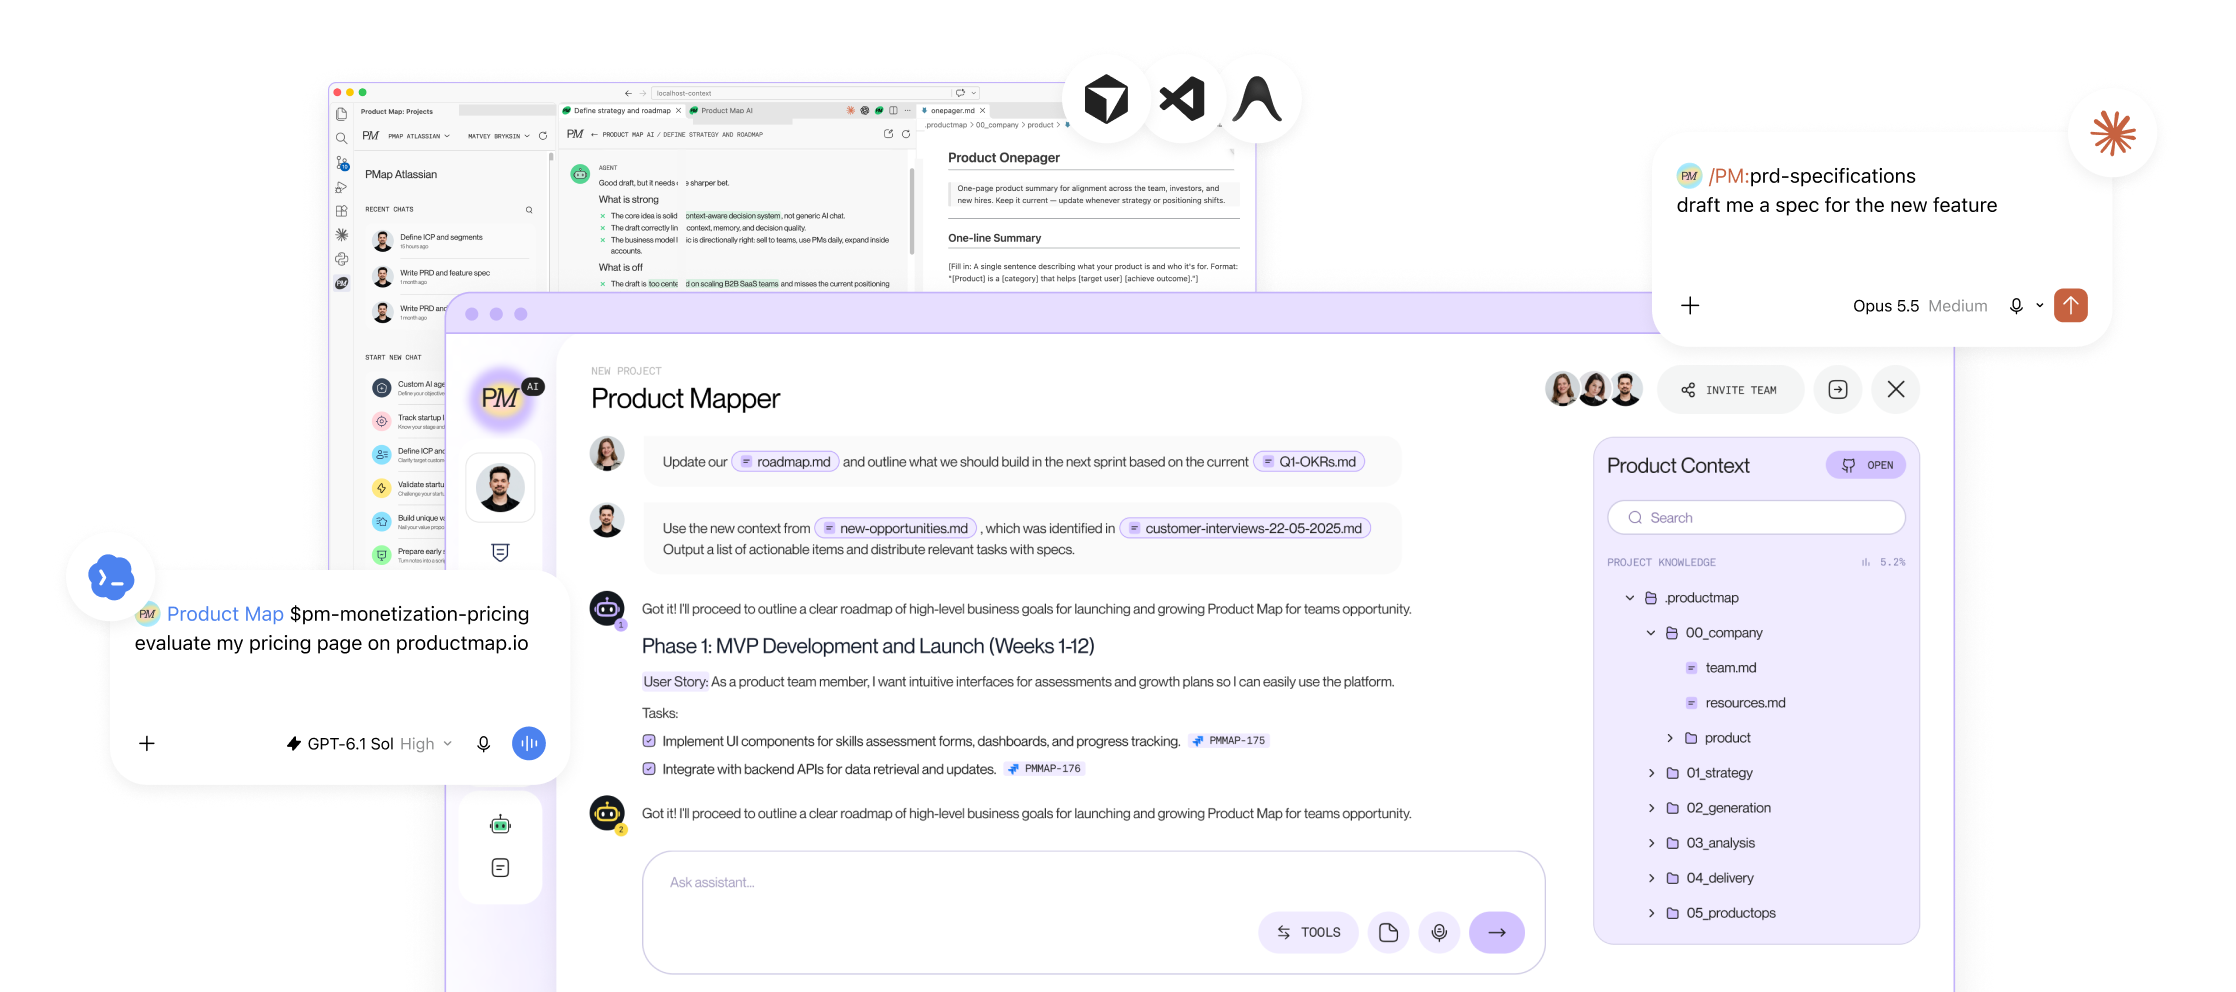
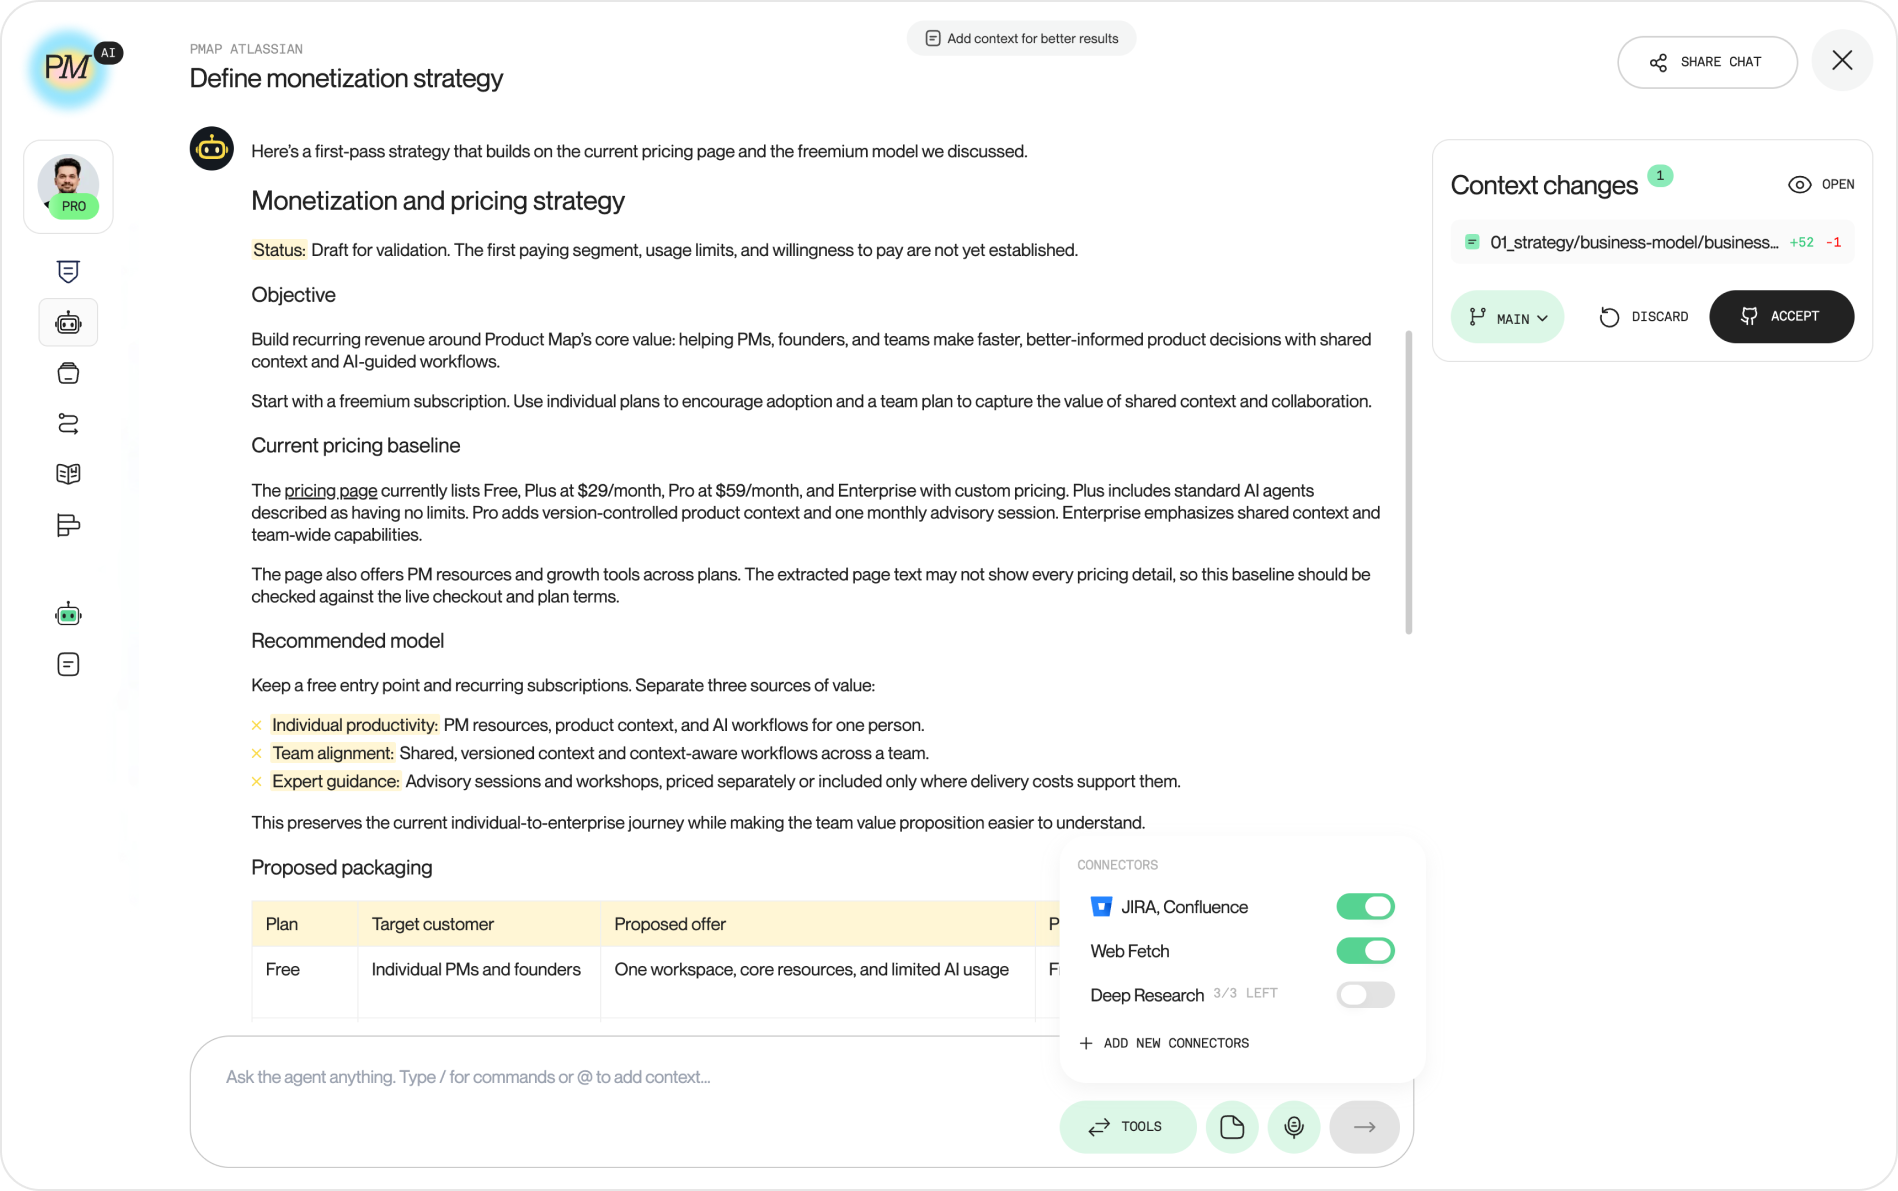
Run it in whichever runtime your team already uses. In a repository, a Claude Code or Codex skill reads pricing-model.md and the unit economics model, pulls the month's inference and billing exports from 10_data/, recomputes, and opens the change. On the platform, the monetization and pricing agent runs the same structure as a conversation: it asks at most two questions, what the product does and who pays, then drafts a first monetization hypothesis with a recommended model, a value metric, and a tier structure, proposes three to five changes, stress-tests the result against willingness to pay and competitive anchors, and audits a pricing page across six scored pillars if you paste the URL. Feed it the cost inputs from the unit economics agent and it fills the floor, cap, and pack lines against your own numbers.
Worked example: one bundled AI feature, before and after
The feature from the opening: a natural-language query assistant inside an analytics product. A user types a question, the assistant writes the query, runs it, and charts the answer. It launched bundled into the $40-per-seat Pro plan because that was the fastest way to ship.
Before, the file didn't exist. The numbers lived in three places: provider pricing in an engineer's bookmark, usage in the warehouse, revenue in billing. Measured after the fact, the picture looked like this:
- Cost per task: P50 $0.06, P90 $0.34. Heavy accounts averaged $0.10 per task because their questions ran over larger schemas with more retries.
- Tasks per account: P50 180 a month, P90 1,400.
- Median account: $10.80 of inference against $40, a 73 percent margin before hosting.
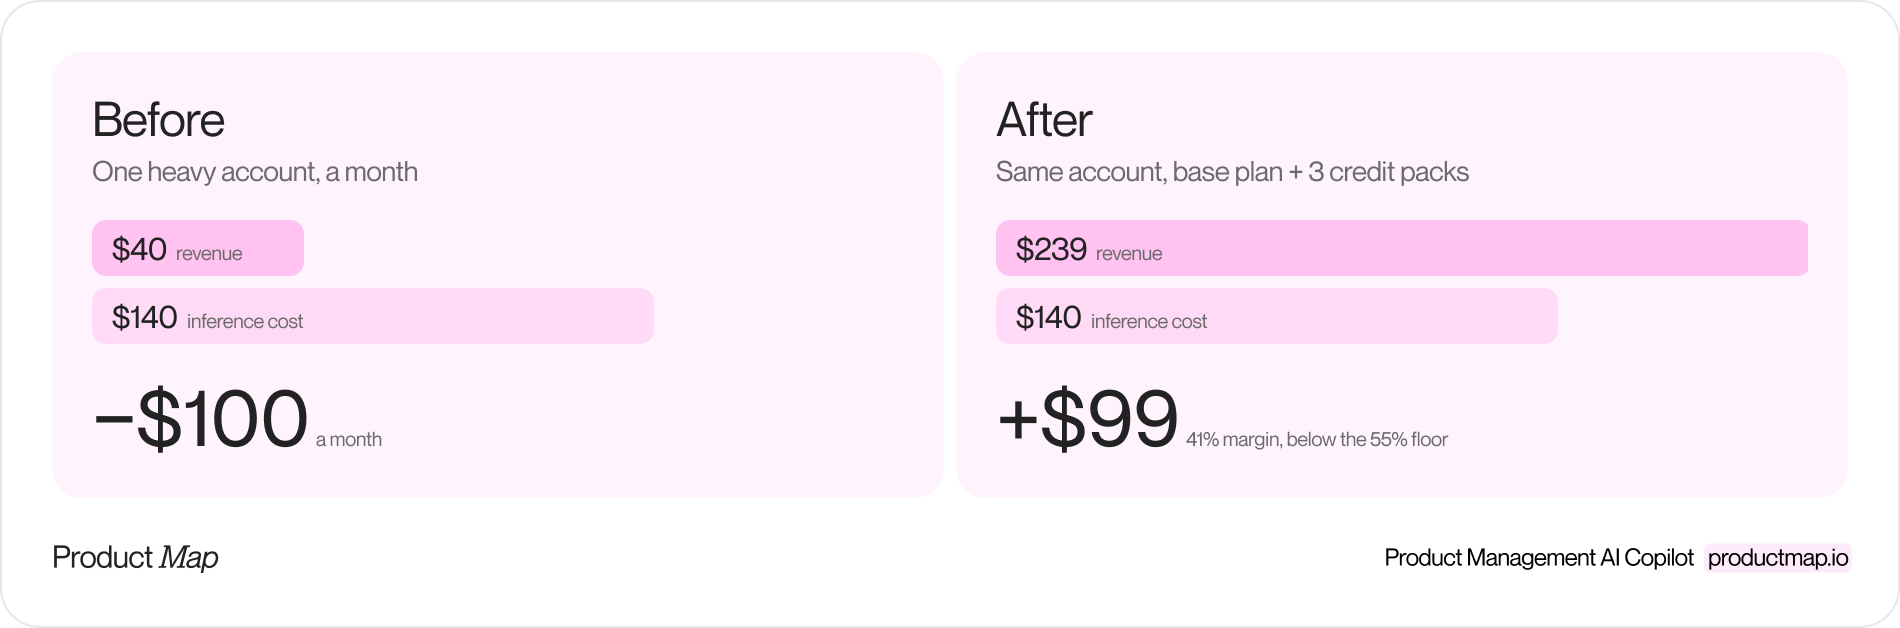
- Heavy account: $140 of inference against $40. Negative by $100 a month.
- Blended: 58 percent gross margin, and the top 8 percent of accounts drove 61 percent of inference spend.
After, with the template filled and a 55 percent floor:
- Base plan: $29 a seat with 150 tasks included. Cost at P50 is $9, a 69 percent margin on included usage. The floor allows up to $13.05 of cost, so the base plan absorbs a 45 percent cost drift before breaching.
- Cap: 540 tasks a month, 3x P50. Past it, the account is prompted to buy a pack. Admins can switch on auto top-up with a ceiling they set.
- Credit pack: 500 tasks for $70, or 14 cents a task, 2.3x the P50 cost, a 57 percent margin at P50 cost.
- The heavy account now: 150 included plus three packs for 1,400 tasks. Revenue $239, cost $140 at their 10-cent per-task rate, margin 41 percent.
That last line is the lesson. The heavy account went from losing $100 a month to a 41 percent margin, and it's still below the floor, because the pack was priced on P50 cost and heavy users don't run at P50 cost. The attribution section catches it: heavy-user per-task cost at 1.7x P50 trips the 1.5x line. The fix is one of three, written as a proposal: a second, larger pack priced on heavy-user cost, routing the expensive query paths to a cheaper model, or a higher cap with a higher base plan for the segment. A deck would have called the migration a success. The file calls it two thirds done.
Who owns the margin floor when the model price drops
The question operators face and pricing articles skip is ownership. Finance owns margin. Product owns the model and the packaging. Sales owns the discount. Nobody owns the moment a provider cuts prices 40 percent and three good options appear at once: keep the price and bank the margin, cut the price and take share, or raise the included cap and sell the same price as more value.
That decision has a deadline, because a competitor with the same provider got the same price cut on the same day. Teams without a file handle it in a Slack thread three weeks later, after the margin report shows the windfall and someone asks why the pricing page didn't move. Teams with a file get a pull request the morning after the price change, with the three options computed, and a named owner on the trigger line who has to pick one.
The reverse case is worse and rarer. Provider prices have mostly fallen, but a model deprecation can force a swap to a pricier replacement, and a quality regression can double attempts per accepted outcome overnight. The file's acceptance-rate threshold and cost-drift trigger are the only early warnings most teams will get, and they only work if someone owns the response.
So the file needs one more line most templates skip, and it's in the triggers section: a name next to each trigger. Not a team. A person who gets the pull request and has until Friday.
Where the file should run
Decide the runtime before you argue about the floor. If your team works in editors with coding agents, commit pricing-model.md to the shared product context repository next to the unit economics model, wrap the recompute in a skill, and let the pull request be the review. No repository yet? Product Map generates the folder from your website and connects it to GitHub, GitLab, Bitbucket, or Azure Repos; drop the pricing file under 01_strategy/business-model/ once it's connected.
If you want the interviewing behavior without setup, open the monetization and pricing agent, tell it what the product does and who pays, and correct the assumption it flags first.
Either way, pricing stops being the slide nobody reopens between planning cycles. It becomes a file with a date on it, a floor the agent checks every month, and a person whose name is next to the trigger. The next time the model price moves, you'll know before the margin report does.
FAQ
What is a margin floor in AI pricing?
It's the gross margin below which a price is wrong. You state it as a percentage, apply it at the P50 account, and check every plan, cap, and credit pack against it. In the worked example, a 55 percent floor on a $29 base plan allows $13.05 of inference cost.
What gross margin should an AI product target in 2026?
The median target in the OpenMeter and Growth Unhinged survey is about 50 percent, down from the 70 to 80 percent SaaS used to assume. Causo suggests pricing the base plan for 60 percent on the P50 user. Pick yours, write it in the file, and hold every plan to it.
How do you calculate cost per task for an AI feature?
Multiply tokens per task by the provider's price per token, then add retrieval and tool-call cost. Compute it at P50 and P90 from your own inference logs, because one average hides the tail. In the worked example, the median task costs six cents and the 90th-percentile task costs 34.
How do you set a usage cap and price a credit pack?
Set the cap as a multiple of median usage; Causo's guidance is about 3x P50. Price each pack so its per-task price clears the floor at P50 cost, then test it at heavy-user cost. A 500-task pack at $70 earns 57 percent at six cents a task and 29 percent at ten.
When does outcome-based pricing fall below the floor?
When the acceptance rate drops under the threshold: cost per attempt divided by the price times one minus the floor. At 50 cents an attempt, a $2.50 price, and a 50 percent floor, the line sits at 40 percent acceptance. Under 20 percent, each accepted outcome costs more than you charge for it.
How often should an agent recompute the pricing file?
Monthly, and whenever a trigger fires: a provider price change, a 20 percent drift in P50 cost within 30 days, more than a tenth of accounts at the cap, or below-floor accounts growing as a share of revenue. The agent recomputes and logs without asking. Any number a customer sees on an invoice waits for a person.
Where does the pricing file live in a context repository?
Save it as pricing-model.md under 01_strategy/business-model/, next to the business model file. Keep it in the same repository as the unit economics model, so both read one set of P50 and P90 cost lines. Commit it like any other context file, and review every change as a pull request.
Do you need Product Map to use the pricing template?
No. The file is plain Markdown, so any person or agent can fill it, and a Claude Code or Codex skill can run the recompute. Product Map adds the generated context folder, the Git connection, and the monetization and pricing agent, which drafts a first hypothesis after two questions at most.